Once a month, on the fourth Thursday of the month, I will put up a long term view of the market. This is provided for investors who don’t want to trade secondary swings in the market, but would like to exit the stock market relatively soon after a bear market begins, or enter the market after a new bull market begins (change in the primary trend). In the blog, they will always have a title called “Long Term (month) (year)”, so you can use your browser “Find” function and easily find them.
Economics:
GDP – The first estimate of 2024 Q1 GDP is +1.6%, following Q4’s +3.4%.
The March Atlanta Fed GDPNow estimate for Q1 GDP was +2.1%, so they got close.
This is neutral for the stock market, just below the long term trend of +2%.
| Year | Quarter | GDP % |
| 2024 | Q1 | 1.6 |
| 2023 | Q4 | 3.4 |
| 2023 | Q3 | 4.9 |
| 2023 | Q2 | 2.1 |
| 2023 | Q1 | 2.0 |
| 2022 | Year | 1.0 |
| 2021 | Year | 5.5 |
| 2020 – Covid | Year | 0.1 |
| 2019 | Year | 2.3 |
| 2018 | Year | 2.9 |
| 2017 | Year | 2.6 |
| 2016 | Year | 2.0 |
Fed interest rates – At the March meeting, the Fed left the Fed Funds rate unchanged at 5.5%.
You can see in the chart below that interest rates other than Fed Funds all ticked up over the month, about one half of a percent. We got a few more statistics that were not friendly for inflation, so the bond market is pricing fewer rate cuts this year so yields “backed up” and existing bond principal values fell. The longer the bond’s duration, the more the principal value will fall in the open market.
After being balanced in the Fall meetings, the Fed indicated that future hikes are likely over. Powell said they will be cautious about timing the first rate cut. The bond market pushed out its timing of the first rate cut to July, with 2 cuts in 2024. The CPI and PCE monthly data has ticked up slightly the last three months and if it does not head back down, the Fed might have to cut its outlook for rate cuts down to two for 2024.
The other thing the Fed is doing is Quantitative Tightening (QT), which means they are not buying bonds to replace those that they hold when they mature, and outright selling bonds into the secondary market. The Fed continues to reduce its balance sheet by $90 billion per month, but they indicated they are thinking about slowing the pace of QT, my guess is they would cut it in half to $45 billion per month.
Local and regional banks have tightened lending standards making it harder for small and medium businesses to get loans to expand. That will slow the economy down somewhat.
The latest CPI was +3.2% versus a year ago. The commodity complex is moving up in price, not good for inflation. Oil, gold, copper, and agricultural products are all rising in price. That could defer the Fed’s first rate cut.
Fed policy is restrictive for the economy, and bearish for the stock market. But we are probably at the peak of interest rates, we have been on pause, and the next move appears to be down.
| Date | Fed Funds Rate | 5 Year Treasury | 10 Year Treasury | 30 Year Treasury |
| Apr 2024 | 5.5 | 4.7 | 4.7 | 4.8 |
| Mar 2024 | 5.5 | 4.2 | 4.2 | 4.4 |
| Feb 2024 | 5.5 | 4.3 | 4.3 | 4.4 |
| Jan 2024 | 5.5 | 4.0 | 4.1 | 4.4 |
| 2023 Q4 | 5.5 | 4.4 | 4.4 | 4.5 |
| 2023 Q3 | 5.5 | 4.4 | 4.3 | 4.4 |
| 2023 Q2 | 5.1 | 3.8 | 3.6 | 3.9 |
| 2023 Q1 | 4.7 | 3.8 | 3.6 | 3.8 |
| 2022 Year | 2.8 | 3.1 | 3.1 | 3.2 |
| 2021 Year | 0.2 | 0.8 | 1.4 | 2.0 |
| 2020 Year | 0.4 | 0.6 | 0.9 | 1.6 – Covid |
| 2019 Year | 2.2 | 1.9 | 2.2 | 2.6 |
| 2018 Year | 1.8 | 2.8 | 2.9 | 3.1 – Tax Cut |
| 2017 Year | 1.0 | 1.9 | 2.3 | 2.9 |
Valuation:
S&P 500 earnings – Factset shows that as of April 19, for Q1 of 2024, the blended year-over-year earnings increase for the S&P 500 is +0.5% (the blend is 14% actual earnings and 86% estimated). That is terrible. You can see in the chart I started keeping below of Factset estimated earnings growth that last month in March they estimated earnings growth for Q1 to be +3.4%, in December they estimated it at +6.2%. The judge recently told Trump’s lawyer “you are losing credibility with this court”, and Factset is losing credibility with me.
The forward PE for the S&P is 19.9 (down from 20.9 last month) compared to the ten year average of 17.8, but remember, the forward PE is just a guess. Stock prices came down over the last month, so the PE came down.
The 12 month forward “operating earnings” estimate on the S&P 500 from the Standard and Poor’s company is $250, up $10 from last month.
I have been thinking about how Factset keeps changing the earnings estimates through the year. This is a number the pros look at, but most of us amateurs do not. The question is, if earnings estimates keep coming down, do stock prices eventually come down? They should, or the PE ratio will continue to climb, making stocks expensive on a PE basis. I’m not going to keep much history, only about 12 months of data. The number that Factset should have the most confidence in is the current quarter, Q1, and it has almost been cut in half from Dec. Tracking this should be fun, at least I think so. Old Rich attempts a new trick.
| MONTH | Q1 Estimate | Q2 Estimate | Q3 Estimate | Q4 Estimate | CY Estimate |
| Apr | 0.5% | 9.6% | 8.7% | 17.7% | 10.7% |
| Mar | 3.4% | 9.3% | 8.4% | 17.4% | 10.9% |
| Feb | 3.9% | 9.0% | 8.0% | 17.6% | 10.9% |
| Jan | 5.4% | 10.0% | 8.2% | 22.1% | 12.0% |
| Dec | 6.2% | 8.5% | 10.7% | 18.1% | 11.5% |
S&P 500 Earnings Estimates, by Month
Telling the future is hard. Why do I even bother to report future estimates of earnings? Earnings (profits) drive the stock market. I look to the pro’s for their estimates, then I take them with a grain of salt. Even if the estimates turn out to be wrong, that is the data that the stock market is trading on today. It’s the best we have, and it may be wrong by a little, or sometimes a lot.
It is interesting that the Q1 estimate which includes 14% actuals came down a full 3%, yet every other quarter went UP, and the CY estimate only went down 0.2%. It is hard to imagine how the stock market will make much progress this year if the year-end estimate for earnings growth keeps falling. But, the Fab Five stocks report this week and things might change if they are very good. Stay tuned.
The outlook for earnings is neutral at +0.5% for Q1.
PE on S&P 500 – The current 12-month trailing GAAP PE on the S&P 500 is 26.1, down a bit from 27.2 last month. I used 4 quarters of earnings with the most recent being Q4 2023. The S&P dropped over the last month, so the valuation fell.
This metric is significantly overvalued relative to my trimmed 30 year average of 19. I trimmed out the quarters during recessions for my 30 year average, since the P/E behaves very abnormally during those times. I go in 5 point increments for my terminology, so 20 – 25 would be moderately overvalued, while 25 – 30 would be significantly overvalued. Above 30 would be dangerously overvalued. On the downside, I will go with 14-18 being moderately undervalued and 9-13 being significantly undervalued. As a last resort, I will go with 4-8 as being egregiously undervalued, and hope we never see that because all investors will be in pain at that point.
This indicator is bearish.
Age of primary move, bull or bear market – This bull market is 19 months old, started in Oct. 2022. The age is neither bullish nor bearish, but it is worthwhile to keep it in mind.
Geo-Political: (One addition this month in Middle East Conflict)
Presidential Election: (added March 2024) – On Nov. 5th we will elect a new president. Joe Biden and Donald Trump are the two primary candidates, and Robert Kennedy Jr. is the main third party candidate. Kennedy cannot win, but he may prevent one of the other two from winning. It depends who he takes more votes away from, and right now we don’t know. Based on forward looking policies, and who the projected winner is, the stock market will start to favor better positioned companies, based on the assumed victorious candidate’s policy priorities. It’s too early to tell, but keep your eyes peeled.
Liquidity: Central banks globally raised rates to fight inflation, but most are pausing their interest rates. Inflation appears to be coming under control, but it is not where the central banks want it. They appear to be on pause to see if the hikes already in place will slow inflation to the target without additional hikes.
US / China: It appears that the US and China are engaged in a tug of war to see who is the world’s economic leader. China has advantages in low cost labor and some natural resources such as rare earth metals, but they lack oil and natural gas. China developed the ability to produce advanced electronics with the aid of the US, but the primary market for those items is the US and Europe. The US has long been a technology leader and we have sophisticated financial markets that are usually well regulated. Another major factor is global alliances. The US has strong alliances with NATO, Canada, Japan, and S. Korea, while China has a strong relationship with Russia.
The economy in China is slowing more than their government would like. Trade tension with the US contributes to the distress since US corporations are expanding outside of China, notably in Vietnam and India. The Chinese govt. has been hostile to free market activity by their own corporations such as Alibaba and Ten Cent. Their real estate sector was over leveraged and is in trouble.
Ukraine: Thewar in Ukraine drags on. Ukraine is having more success on the battlefield than most expected, with the help of western weapons. Russia is destroying much of eastern Ukraine’s cities and rebuilding will be difficult. Sanctions against Russia are disrupting commodity markets since Russia was such a large exporter or oil, natural gas, and metals. Ukraine was a large exporter of wheat and other foods and that export is hindered by the war. It appears that after the initial shock in the commodity markets when Russia invaded, prices have stabilized and the world is dealing with new sources and trading patterns.
Middle East Conflict: Hamas launched a violent attack on Israel on Oct. 7, 2023 using missiles and ground forces and Israel has responded with bombings inside Gaza. It’s a mess, but impact to the US economy is not noticeable. The Houthi rebels in Yemen are firing missiles at shipping in the Red Sea, causing many ships to go around Africa to Europe instead of using the shorter Suez Canal. That will increase wait times and raise transportation costs. Israel bombed an Iranian embassy in Syria, killing 2 Iranian Generals, Iran sent 300 drones and missiles into Israel (which were mostly shot down), and Israel retaliated with a strike inside Iran on a military installation. The stock market sold off in April 2024, down 5%.
US National Debt: (added Sept. 2023) The US national debt is very large at over $34 trillion and it is growing too rapidly. I have been concerned about it since early in this century. If there is too much new debt and investors don’t want to buy the bonds that the US issues to fund the deficit, they may have to keep the interest rates high, particularly longer term interest rates, high enough to attract bond investors. Companies will then have to pay higher rates to fund long term projects and that will cut into their profits. Consumers facing high interest rates will slow purchases. It is not a good situation for the economy.
Geo-politics is currently bearish, mainly due to the wars in Ukraine, global central banks restrictive policy, and the Israeli conflict with Hamas and Iran.
Technical:
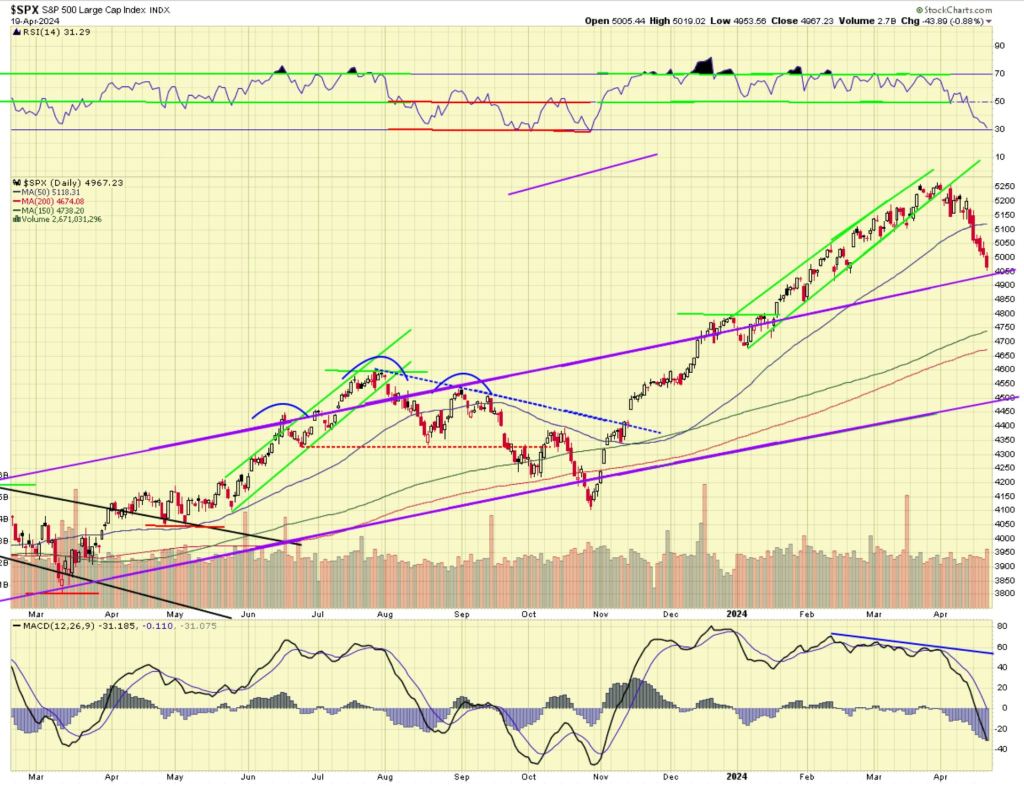
Technically the chart below is neutral near term (months), and still positive longer term (year). It is important to note this is on a “long term” basis, and is not the same verdict as you would see on the weekly report which is a 12 month basis instead of this 10 year view.
RSI at the top of the chart is neutral at 63 and falling. Momentum shown by MACD at the bottom of the chart is positive and rising, but the most recent histogram shrunk a little. The price action is neutral near term and positive longer term.
The price action is neutral near term as it has come down and sits right on the upper bound of the long term up-channel.
This close to the top of the up-channel, there is the risk of a correction. We can also go higher, above the top of the channel, like we did in 2021, but that was driven by excessive stimulus from the Covid cash infusion cycle from the govt. I don’t see that type of stimulus now, in fact the Fed interest rates are restrictive. What seems to be giving the market this boost is the computing revolution called Artificial Intelligence (AI).

Ten Year Chart of the S&P 500
This is neutral in the short run, and remains bullish longer term.
Conclusion:
- GDP growth is neutral with Q1 GDP rising by 1.6%.
- The Fed has short term rates at 5.5%. That is restrictive and bearish.
- S&P earnings for Q1 are estimated to be +0.5% above Q1 2023 which is neutral.
- The PE valuation of the S&P based on the 12 month trailing GAAP number is 26.1, which is significantly overvalued and bearish.
- The geo-political factors are bearish.
- Technically the chart looks neutral short term, and bullish longer term.
By that way of looking at it, the market is bearish, with three factors bearish, and three neutral.
Long Term Issues to Keep in Mind:
National Debt:
(January 2024) – The national debt is over $34 trillion.
(Late 2020) – The total national debt exceeds $26 Trillion, and as interest rates rise, the component of the annual budget allocated to “interest on the debt” will increase, putting pressure on existing programs, or increasing the deficit. If the deficit is allowed to rise too much in good economic times, the value of the dollar will fall and that is inflationary which is usually bad. The thing saving us today is how poorly all the other nations are managing their economies, so the dollar continues to hold up.
(Updated March 2020) – Covid 19 begins. Well this is going to get a lot worse. Looks like the politicians are going to be printing money and dropping it from helicopters. But all the other major economies will do the same thing, so relatively, the dollar may not drop much (which would be bad for inflation).
(Negative – Noted Jan. 2018) The deficit will go up despite the republicans saying that if the tax cut bill is “dynamically scored” using “possible” increases in economic activity, it will hold down the deficit by increasing tax receipts. This has not been shown to work in the past. The US added $980 billion to the national debt in fiscal 2019 (ended 9/30/2019), a tragedy in good financial times.
Rich Comeau, Rich Investing