I update each Saturday with my view of the stock market for the next few weeks. The monthly “Long Term” update will be on a Wednesday soon after the 15th of each month, and this supports investors who want to buy and hold, but want to sell to avoid the bulk of a crash, and buy back in for most of the next bull market. You can always scroll down a few weeks and find the latest “Long Term” update.
If you lose your bookmark to the blog, google “Rich Investing” and it should show up on the first page or so. The more often you google it and hit the link, the higher it will show in your results.
Just below this post is the monthly Long Term update for Nov., so if you follow those, just keep scrolling down.
I am sorry for being a day late with this update, but family was in the house on Saturday.
Economy:
The University of Michigan’s consumer-sentiment index fell to 97.5 in November from 98.6 (this has been going mostly sideways in 2018). Existing-home sales ran at a seasonally adjusted annual rate of 5.22 million in October, marking the first monthly increase in six months. The leading economic index rose 0.1% in October after 0.6% and 0.5% gains in the prior two months, pointing to a slight cooling of the economy in the months ahead. The economy continues to perk along, but the rate of growth is slowing a bit.
Geo-Political:
The most important issue for the stock market in the week ahead is the G20 meeting in Buenos Aires, where Trump and China president Xi are scheduled to talk. At the recent Apec meeting in Asia, for the first time it ended without a joint communiqué on the outcome as not all members could agree on a statement. More countries are joining with the US in opposing China trade practices and investment opportunities in China.
From China:
China has warned against a repeat at the upcoming G20 summit of the failure of Apec nations to take a united stand on economic development last weekend.
China issued the warning on Friday as preparations were under way for Chinese President Xi Jinping and his US counterpart Donald Trump to meet on the sidelines of the G20 gathering in Buenos Aires, Argentina, next week.
Chinese vice-minister of commerce Wang Shouwen said Beijing did not wish to see the failure of the Asia-Pacific Economic Cooperation forum happen again.
“On the reform of the World Trade Organisation and multilateral trade organisations, certain members insisted on imposing their own interest first at the expense of other members’ interests,” Wang said. “So there was no consensus reached on this issue, nor was there a joint declaration produced after the leaders’ summit.
“We do not want to see the same situation happen again at the G20.
“We hope the G20 can discuss WTO reform, and express opposition to unilateralism and protectionism.”
If the US does garner broad support for changes in China, then China will have to change. Unfortunately, getting there can be painful for all of us.
Technical Analysis:
It was another down week for the market, ending right at the low for the week. Keep in mind that the holiday week has many traders out so volume is low, and one should not draw conclusions based on such odd data.
Technically the market action is bearish. RSI at the top of the chart is at 36 and falling, which is near oversold. MACD at the bottom of the chart is negative and heading down. Price action is precarious sitting at first support at 2632, the late Oct. low. We could put in a small double bottom here for a short term rally, or continue down to the next support level at 2580, the April low. Much will depend on the news coming out of Buenos Aires.
My suspicion is that CEO’s are calling anyone that will listen in the administration and telling them they better do a deal with China as the economy is slowing, China is slowing, Europe is slowing, Asia is slowing, and we are at risk of having a big global problem. Trump is scheduled to raise tariffs on $250 billion of Chinese imports in January, from the current 10% imposed in Sept., to 25%. He could lessen the scheduled increase, or better yet, push it back based on making progress in talks with China. That’s probably the best outcome, and I would expect a rally based on news like that. If no progress is made then we could see another selloff.
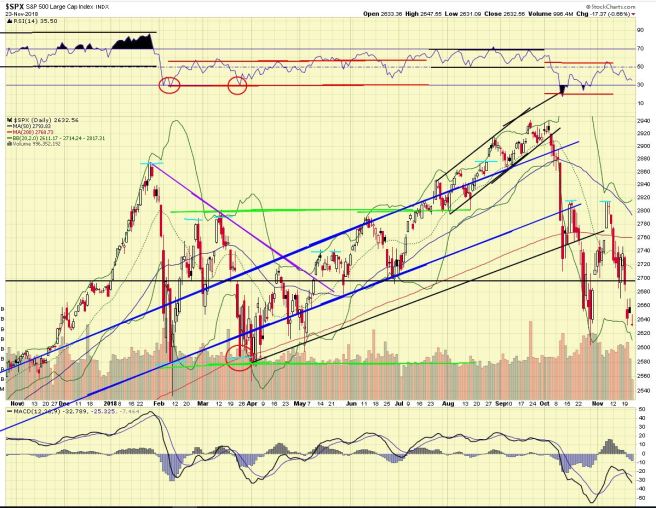
Click THIS LINK to open the chart in a separate window.
I didn’t do anything last week, except work on a buy list. I’m mostly out of the market, the monthly long term update continues bullish for the long term, so at some point I will want to buy back in, although bonds are more attractive now and I am considering how much to allocate to individual bonds and CD’s (no bond funds) that mature in one year, as we are late in the bull market.
If you enjoy these updates, please tell your friends and family who are interested in the stock market about this blog.
Your comments and questions are always appreciated, so feel free to comment using the “Leave a Comment” feature just under the title of the post, or send me an email, my address is on the “About” page at the top of the blog.
You can use the hyperlink below the chart of the S&P that will open a larger picture of the chart in a separate window. The reader who suggested this wants to look at the chart side-by-side with the blog text so he can look at the chart while reading the text. To do this in Firefox you can open a “private window” from the browser menu and have two instances of Firefox up, then size each window to about half of your monitor size. If you bookmark the link you can look at it each day of the week to see how the market is progressing to certain milestones.
Rich Comeau, Rich Investing


