Long Term – February 2024

Once a month, on the fourth Thursday of the month, I will put up a long term view of the market.  This is provided for investors who don’t want to trade secondary swings in the market, but would like to exit the stock market relatively soon after a bear market begins, or enter the market after a new bull market begins (change in the primary trend).  In the blog, they will always have a title called “Long Term (month) (year)”, so you can use your browser “Find” function and easily find them.

Economics:

GDP – The second estimate of 2023 Q4 GDP is +3.2%, following Q3’s +4.9%. 

That is a warm read, well above the long term 2.0% trend.  By itself, it would not prompt the Fed to hike the Funds rate, but it would push out the estimated time for the first easing.

This is bullish for the stock market.

YearQuarterGDP %
2023Q43.2
2023Q34.9
2023Q22.1
2023Q12.0
   
2022Year1.0
2021Year5.5
2020 – CovidYear0.1
2019Year2.3
2018Year2.9
2017Year2.6
2016Year2.0

Fed interest rates – At the January meeting, the Fed left the Fed Funds rate unchanged at 5.5%.

After being balanced in the Fall meetings, the Fed indicated that future hikes are likely over.  Powell said they will be cautious about timing the first rate cut.  The bond market pushed out its timing of the first rate cut to June, with 3 cuts in 2024. 

The other thing the Fed is doing is Quantitative Tightening (QT), which means they are not buying bonds to replace those that they hold when they mature, and outright selling bonds into the secondary market.  The Fed continues to reduce its balance sheet by $90 billion per month and they have not indicated that they will end QT anytime soon.  This provides a constant supply of bonds in the marketplace and the market may have to offer higher interest rates to entice people to buy those bonds.  Are we seeing that in action right now, with rates backing up?  The treasury also sends a constant stream of bonds to the marketplace to finance our obscene deficit.

Local and regional banks have tightened lending standards making it harder for small and medium businesses to get loans to expand.  That will slow the economy down somewhat.

The latest CPI was +3.1% versus a year ago.  The 30 year fixed mortgage has ticked back up to 7.4% as the whole interest rate complex moved up a little, since the Fed indicated a slower pace of rate cuts this year.

Fed policy is restrictive for the economy, and bearish for the stock market.  But we are probably at the peak of interest rates, we have been on pause, and the next move appears to be down.  That will eventually be good.

DateFed Funds Rate5 Year Treasury10 Year Treasury30 Year Treasury
Feb 20245.54.34.34.4
Jan 20245.54.04.14.4
     
2023 Q45.54.44.44.5
2023 Q35.54.44.34.4
2023 Q25.13.83.63.9
2023 Q14.73.83.63.8
2022 Year2.83.13.13.2
2021 Year0.20.81.42.0
2020 Year0.40.60.91.6 – Covid
2019 Year2.21.92.22.6
2018 Year1.82.82.93.1 – Tax Cut
2017 Year1.01.92.32.9

Valuation:

S&P 500 earnings – Factset shows that as of Feb. 16, for Q4 of 2023, the blended (79% actual, 21% estimated) year-over-year earnings increase for the S&P 500 is +3.2%.  It appears we have exited the “earnings recession” of 2023.

The forward PE for the S&P is 20.4 (up from 19.5 last month) compared to the ten year average of 17.7, but remember, the forward PE is just a guess. 

The 12 month forward “operating earnings” estimate on the S&P 500 from the Standard and Poor’s company is $240, unchanged from last month.

The Factset earnings estimate for 2024 Q1 is +3.9% (down from +5.4% a month ago) and their estimate for calendar year (CY) 2024 is +11% (down from 12% last month).  Earnings estimates in 2024 will have an easy comparison of year over year since the 2023 numbers were negative in Q1 and Q2 of 2023.

I made a point to contrast what future earnings estimates from Factset are compared to last month, and there is quite a big difference.  Telling the future is hard.  Why do I even bother to report future estimates of earnings?  Earnings (profits) drive the stock market.  I look to the pro’s for their estimates, then I take them with a grain of salt.  Even if the estimates turn out to be wrong, that is the data that the stock market is trading on today.  It’s the best we have, and it may be wrong by a little, or sometimes a lot.

The outlook for earnings is bullish at +3.2% for Q4.

PE on S&P 500 – The current 12-month trailing GAAP PE on the S&P 500 is 26.8, up a bit from 25.7 last month.  I used 4 quarters of earnings with the most recent being Q4 2023.  The S&P rallied upward since Nov. 2023, faster than earnings growth, so the valuation rose. 

This metric is significantly overvalued relative to my trimmed 30 year average of 19.  I trimmed out the quarters during recessions for my 30 year average, since the P/E behaves very abnormally during those times.  I go in 5 point increments for my terminology, so 20 – 25 would be moderately overvalued, while 25 – 30 would be significantly overvalued.  Above 30 would be dangerously overvalued.  On the downside, I will go with 14-18 being moderately undervalued and 9-13 being significantly undervalued.  As a last resort, I will go with 4-8 as being egregiously undervalued, and hope we never see that because all investors will be in pain at that point.

This indicator is bearish.

Age of primary move, bull or bear market – This bull market is 17 months old, started in Oct. 2022.  The age is neither bullish nor bearish, but it is worthwhile to keep it in mind. 

Geo-Political: (No change this month)

Liquidity:  Central banks globally raised rates to fight inflation, but most are pausing their interest rates.  Inflation appears to be coming under control, but it is not where the central banks want it.  They appear to be on pause to see if the hikes already in place will slow inflation to the target without additional hikes.

US / China:  It appears that the US and China are engaged in a tug of war to see who is the world’s economic leader.  China has advantages in low cost labor and some natural resources such as rare earth metals, but they lack oil and natural gas.  China developed the ability to produce advanced electronics with the aid of the US, but the primary market for those items is the US and Europe.  The US has long been a technology leader and we have sophisticated financial markets that are usually well regulated.  Another major factor is global alliances.  The US has strong alliances with NATO, Canada, Japan, and S. Korea, while China has a strong relationship with Russia.

The economy in China is slowing more than their government would like.  Trade tension with the US contributes to the distress since US corporations are expanding outside of China, notably in Vietnam and India.  The Chinese govt. has been hostile to free market activity by their own corporations such as Alibaba and Ten Cent.  Their real estate sector was over leveraged and is in trouble.

Ukraine:  Thewar in Ukraine drags on.  Ukraine is having more success on the battlefield than most expected, with the help of western weapons.  Russia is destroying much of eastern Ukraine’s cities and rebuilding will be difficult.  Sanctions against Russia are disrupting commodity markets since Russia was such a large exporter or oil, natural gas, and metals.  Ukraine was a large exporter of wheat and other foods and that export is hindered by the war.  It appears that after the initial shock in the commodity markets when Russia invaded, prices have stabilized and the world is dealing with new sources and trading patterns.

Middle East Conflict:  Hamas launched a violent attack on Israel on Oct. 7, 2023 using missiles and ground forces and Israel has responded with bombings inside Gaza.  It’s a mess, but impact to the US economy is not noticeable.  The Houthi rebels in Yemen are firing missiles at shipping in the Red Sea, causing many ships to go around Africa to Europe instead of using the shorter Suez Canal.  That will increase wait times and raise transportation costs.

US National Debt:  (added Sept. 2023)  The US national debt is very large at over $34 trillion and it is growing too rapidly.  I have been concerned about it since early in this century.  If there is too much new debt and investors don’t want to buy the bonds that the US issues to fund the deficit, they may have to keep the interest rates high, particularly longer term interest rates, high enough to attract bond investors.  Companies will then have to pay higher rates to fund long term projects and that will cut into their profits.  Consumers facing high interest rates will slow purchases.  It is not a good situation for the economy.

Geo-politics is currently bearish, mainly due to the war in Ukraine and global central banks restrictive policy.

Technical:

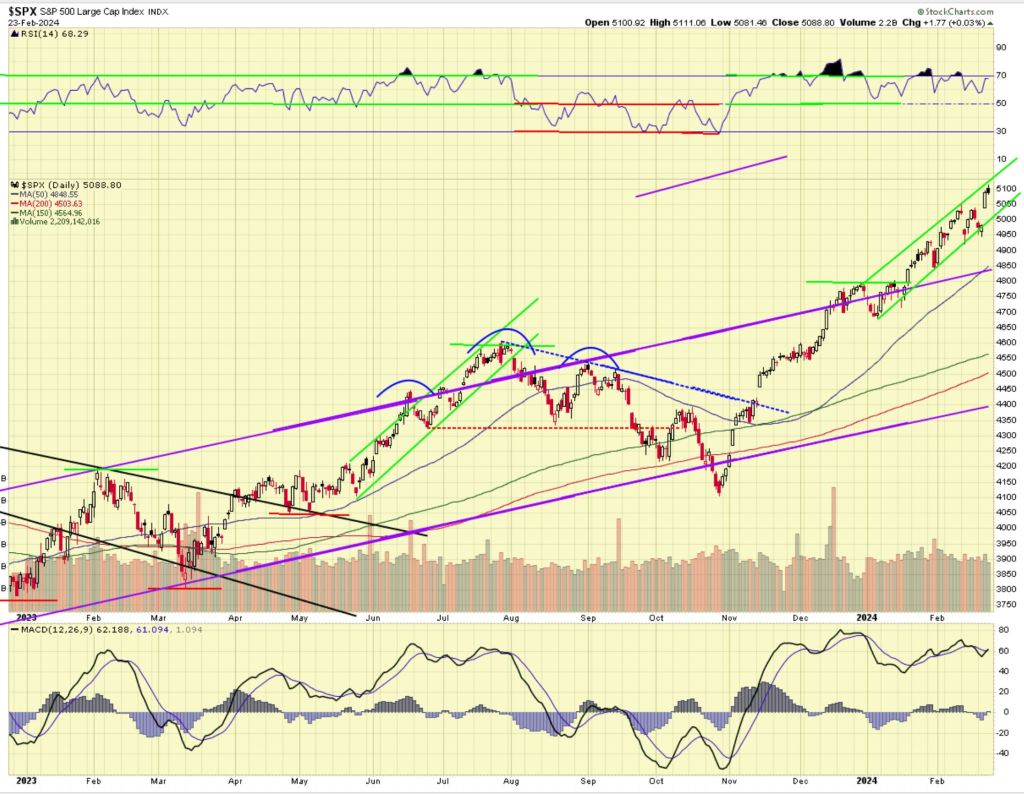
Technically the chart below is bullish near term (months), and still positive longer term (year).

RSI at the top of the chart is positive at 67 and rising.  Momentum shown by MACD at the bottom of the chart is positive and rising.  The price action is positive near term and positive longer term.  

The price action is near the top of the long term up-channel, which will limit the upside probability from here.  Resistance comes in when we hit the top of the channel (we don’t have to go that high) around the 5,000 level.

This close to the top of the up-channel, there is the risk of a correction.  We can also go higher, above the top of the channel, like we did in 2021, but that was driven by excessive stimulus from the Covid cash infusion cycle from the govt.  I don’t see that type of stimulus now, in fact the Fed interest rates are restrictive.

Ten Year Chart of the S&P 500

This is bullish in the short run, and remains bullish longer term.

Conclusion:

  1. GDP growth is bullish with Q4 GDP rising by 3.3%. 
  2. The Fed has short term rates at 5.5%.  That is restrictive and bearish
  3. S&P earnings for Q4 are +3.2% above Q4 2022 which is bullish
  4. The PE valuation of the S&P based on the 12 month trailing GAAP number is 26.8, which is significantly overvalued and bearish.
  5. The geo-political factors are bearish.  
  6. Technically the chart looks bullish short term, and bullish longer term.

By that way of looking at it, the market is neutral, with three factors bearish, and three bullish.

Long Term Issues to Keep in Mind:

National Debt: 

(January 2024) – The national debt is over $34 trillion.

(Late 2020) – The total national debt exceeds $26 Trillion, and as interest rates rise, the component of the annual budget allocated to “interest on the debt” will increase, putting pressure on existing programs, or increasing the deficit.  If the deficit is allowed to rise too much in good economic times, the value of the dollar will fall and that is inflationary which is usually bad.  The thing saving us today is how poorly all the other nations are managing their economies, so the dollar continues to hold up.

(Updated March 2020) – Covid 19 begins.  Well this is going to get a lot worse.  Looks like the politicians are going to be printing money and dropping it from helicopters.  But all the other major economies will do the same thing, so relatively, the dollar may not drop much (which would be bad for inflation).

(Negative – Noted Jan. 2018)  The deficit will go up despite the republicans saying that if the tax cut bill is “dynamically scored” using “possible” increases in economic activity, it will hold down the deficit by increasing tax receipts.  This has not been shown to work in the past.  The US added $980 billion to the national debt in fiscal 2019 (ended 9/30/2019), a tragedy in good financial times.

Rich Comeau, Rich Investing

NVDA Rally

I update each Saturday with my view of the stock market for the next few weeks (if occupied with family or travel, rarely I am a day or two late, just check back).  The monthly “Long Term” update will be on the fourth Thursday of each month, and this supports investors who want to buy and hold, but want to sell to avoid the bulk of a primary bear market, and buy back in for most of the next bull market.

If you lose your bookmark to the blog, google “Rich Investing Blog” and it should show up on the first page or so.

The monthly Long Term update will be posted Thursday Feb. 29th.  Happy Leap Year!!!

Economy:

Existing home sales for Jan. were 4 million annualized, a light number but the winter is a slow time for home sales, and the 30 year fixed mortgage has risen from 6.8% a few months ago to 7.4%.

The Leading Economic Indicators for Jan. were up -.4%, compared to -.2% in Dec.  This little article provides more depth into the number:

“2/20/2024 – The Conference Board’s Leading Economic Index – a gauge of future economic activity — dropped 0.4% to 102.7 in January, signaling the lowest level since April 2020 when the US economy was struck by the COVID-19 pandemic-spurred lockdowns.

It marks the 23rd straight month that the index has declined, but the decline has slowed sharply and most of the gauge’s 10 indicators are now flashing positive. The fresh data prompted the Conference Board to announce that a recession is no longer imminent for the first time since summer 2022.

“The U.S. LEI fell further in January, as weekly hours worked in manufacturing continued to decline and the yield spread remained negative,” the Conference Board’s Justyna Zabinska-La Monica said on Tuesday.

While the declining LEI continues to signal headwinds to economic activity, for the first time in the past two years, six out of its ten components were positive contributors over the past six-month period (ending in January 2024). As a result, the leading index currently does not signal recession ahead.

Still, the group added that despite no recession forecast for 2024, “near-to-zero” real GDP growth should be expected in the second and third quarters.”

https://finance.yahoo.com/news/closely-watched-gauge-economic-activity-052450832.html

There is a lot in that brief article, so read it over again.  I wrote a few weeks ago about this indicator not working the way it is supposed to.  It normally would have predicted a recession months ago, which did not occur.  I think the huge cash infusion into the economy from the Covid support programs (at least $3 trillion), outright giveaways and enhanced unemployment benefits, have supported the economy.  The increase in interest rates over the last 2 years has put downward influence on the LEI, but when you start from ZERO, interest rate hikes probably don’t hurt the economy that bad for a while.  One could say that rates now are back to normal levels seen in the 1980’s and up to 2007.  There is a LOT of money in money market accounts that was earning near zero for over a decade, and now those interest payments provide a good income stream.  Many retirees are able to spend for home improvements, or take vacations that they have not been able to do with zero interest rates.  I think that is why the indicator did not work.  Government spending and the Fed interest rates have been way out of line with what is normal, for years.  For an indicator to work, you need stable economic conditions, but since the GFC (great financial crisis of 2008) and Covid, economic conditions have not been stable.

Geo-Political:

The Fed minutes from the last meeting were released, and they indicate that the Fed is not in a hurry to make the first rate cut.  This would normally be a negative for stocks, but in the NVDA mania, it was overlooked.  As we move on from AI earnings season, this could come to bear on the market.

Technical Analysis:

For the week ending 2/23/2024, the S&P 500 was up 1.6%%, setting a new all-time high.

Technically (see chart below) the market looks positive, but extended.  RSI at the top of the chart is overbought at 69.  Momentum shown by MACD at the bottom of the chart is neutral, moving sideways.  The price action is positive, but it is rising at a rate that is not sustainable in the long run.  We can still see the last AI mania on the chart from late May to late July, until rationality returned to the market.  Rationality will return to the market again, we just don’t know when.

This is not a good entry point for a long term holding.  One can make money on short term trades.  My process a few weeks ago was to make small buys in the hot stocks on pullbacks, and protect those with a trailing stop loss order, down about 5% to limit one’s loss if the market moves against you.

The danger can be seen in a high flying stock that disappoints even a little, like happened to Palo Alto Networks (PANW), last week.  Guidance was not up to the analyst’s expectations, and the stock fell 25% overnight.  I bought a little PANW on the pullback.  The news also took down CRWD and FTNT, so I bought a bit of them.  These are the cyber security stocks and I think hackers will be with us for the foreseeable future.  PANW mentioned in their guidance that they are getting pushback from corporate America on the high fees. If that becomes more widespread, it could produce a broader economic slowdown.

Click THIS LINK to open the chart in a separate window.

What am I doing?  I did some trading, buying a little into some high flyers like NVDA, but I took my profit before earnings.  I left money on the table, but I’m OK with that.  I did buying in the cyber security names; CIBR is an ETF that contains many of them.  I was selling a lot of covered calls since many expired on 2/16.  I added a little RTX.

———————–  

If you enjoy these updates, please tell your friends and family who are interested in the stock market about this blog.

I would like to call your attention to a page of my blog called “CLASSICS”.  It is located at the top of the blog, on the banner just under the title.  The banner has links to “Home”, “About”, and now “Classics”.  These are articles that I wrote one time for the blog, but they are valuable insights at all times for investors.  I will announce in the weekly blog when I add a new classic.

There are currently 3 Classic topics posted:

  • Is it a bull market or a bear market?
  • Why does healthcare cost so much?
  • Implications of a large national debt. (posted August 2022)

Your comments and questions are always appreciated, so feel free to comment using the “Leave a Comment” feature just under the title of the post.

You can use the hyperlink below the chart of the S&P that will open a larger picture of the chart in a separate window.  The reader who suggested this wants to look at the chart side-by-side with the blog text.  If you bookmark the link to the chart you can look at it each day of the week to see how the market is progressing to certain milestones.  The picture in this post is a static .jpg so it does not update.

I am a retired person and preserving capital and seeking income are important objectives for me.  I also want a growth component to my portfolio, while minimizing major risk.  My style of investing will not suit everyone.  I like to sleep well at night.  Investing involves risk, including the risk of loss.

Rich Comeau, Rich Investing

Inflation Concerns?

I update each Saturday with my view of the stock market for the next few weeks (if occupied with family or travel, rarely I am a day or two late, just check back).  The monthly “Long Term” update will be on the fourth Thursday of each month, and this supports investors who want to buy and hold, but want to sell to avoid the bulk of a primary bear market, and buy back in for most of the next bull market.

If you lose your bookmark to the blog, google “Rich Investing Blog” and it should show up on the first page or so.

Economy:

Retail sales dropped .8% in Jan., not good, but perhaps just a dip after a holiday binge.

On Tue. the 13th, CPI for Jan. was +.3%, up from .2% in Dec., and the CPI Y-o-Y was 3.1%, down from 3.4% in Dec.  The market sold off on Tuesday, but it has been so strong since Nov. 1 that it just needed any excuse to go down.  On Friday the 16th, the PPI for Jan. was up .3% after being -.1% in Dec., and the PPI Y-o-Y was up 1%.

The market did not like the inflation data and the market was down marginally for the week.

The Fed officials advised that we take this point in time data with a grain of salt.  The trend of inflation is generally downward, and the trend is not changed by one data point.

Geo-Political:

Last week I wrote about the CBO study that showed we will add $20 trillion to the US debt, bringing it up to $55 trillion over the next 10 years.  That sounds irresponsible, and both repubs and dems have contributed to the problem.  A year ago, the CBO put forth their ideas of ways to reduce the deficit, along with some quantification.  I looked over the list, and as I said last week, they all involve pain, it is just a question of whose ox gets gored.  Here are their suggestions: https://www.cbo.gov/publication/58981

President Obama commissioned a bi-partisan group to come up with a solution to the deficits.  It was the Simpson-Bowles commission and they produced a balanced plan of tax increases and spending cuts, and nothing was done.  It involved pain, and congressmen are afraid if they hurt people they will be thrown out of office, so they don’t do anything.

So, how does this even work, all this deficit spending and money printing?  One of the factors is that the US dollar is the reserve currency of the world.  To be a reserve currency, there has to be enough of the currency that it can be used across the world in the largest applications.  Nothing rivals the US dollar.  The second factor in being the reserve currency is that the rest of the world believes that the currency has a reputable and reasonable manager, in this case the US congress, Treasury and Federal Reserve.  That belief is under some stress now.  People have looked and tried to find an alternate, but they can’t find one, yet.  Possible alternates are the Euro, and Yuan, but the world will not salute those.  Neither of those has the volume required, and their governments have not done such a good job managing their financial affairs.

The long term risk of running a high deficit and debt to GDP ratio well north of 100% are that the dollar could weaken in value, which is inflationary.  The traditional cure for inflation is to raise interest rates to slow the economy down, reducing the demand for goods.  That would also reduce income tax receipts if workers end up being laid off.  Then the deficit would get worse, we’d print more money, and inflation could persist, with slow growth.  In the 1970’s they called it stagflation, stagnant economy and inflation, and it was not a good time for the stock market.  Today the government deficits are over 20 times larger than the deficits in the 1970’s.

When monetary policy got that screwed up, it was not a good time for “long term investing”.  There was a bad recession in 73-74 caused by the oil shock when Saudi Arabia stopped selling oil to the US.  That drove inflation up.  There was another deep recession in 81-82 when Fed Chair Volker hiked interest rates until he broke the inflation, plunging the economy into recession.  The high interest rates worked, but deficits in those days were in the $30 billion to $60 billion per year range, totally different than today.  There were some good years for the stock market between 74 and 81, but you had to be nimble to take advantage of them.

Technical Analysis:

For the week ending 2/16/2024, the S&P 500 was down .5%.  But, we did set a new all-time high during the week.

Technically (see chart below) the market looks good, but extended to the upside.  RSI at the top of the chart is high-neutral at 62.  Momentum shown by MACD at the bottom of the chart is neutral and going sideways, so there is a little loss of energy to the upside.  The price action is positive, but far above the top of the channel (purple line) and the 50 day moving average.

Click THIS LINK to open the chart in a separate window.

What am I doing?  I am not buying much stock.  Eventually we will get a pullback and I hope to buy stocks at lower prices.  I did some short term trading in some of the AI five stocks, buying a little on a pullback and selling after it went back up.  It won’t make me rich, but it will at least keep me in box-wine for a few more months!  I kept a trailing stop loss under the few shares until I was ready to luckily take my profit, then I cancelled the trailing stop and sold the stock.

———————–  

If you enjoy these updates, please tell your friends and family who are interested in the stock market about this blog.

I would like to call your attention to a page of my blog called “CLASSICS”.  It is located at the top of the blog, on the banner just under the title.  The banner has links to “Home”, “About”, and now “Classics”.  These are articles that I wrote one time for the blog, but they are valuable insights at all times for investors.  I will announce in the weekly blog when I add a new classic.

There are currently 3 Classic topics posted:

  • Is it a bull market or a bear market?
  • Why does healthcare cost so much?
  • Implications of a large national debt. (posted August 2022)

Your comments and questions are always appreciated, so feel free to comment using the “Leave a Comment” feature just under the title of the post.

You can use the hyperlink below the chart of the S&P that will open a larger picture of the chart in a separate window.  The reader who suggested this wants to look at the chart side-by-side with the blog text.  If you bookmark the link to the chart you can look at it each day of the week to see how the market is progressing to certain milestones.  The picture in this post is a static .jpg so it does not update.

I am a retired person and preserving capital and seeking income are important objectives for me.  I also want a growth component to my portfolio, while minimizing major risk.  My style of investing will not suit everyone.  I like to sleep well at night.  Investing involves risk, including the risk of loss.

Rich Comeau, Rich Investing

Trees Don’t Grow to the Sky!

I update each Saturday with my view of the stock market for the next few weeks (if occupied with family or travel, rarely I am a day or two late, just check back).  The monthly “Long Term” update will be on the fourth Thursday of each month, and this supports investors who want to buy and hold, but want to sell to avoid the bulk of a primary bear market, and buy back in for most of the next bull market.

If you lose your bookmark to the blog, google “Rich Investing Blog” and it should show up on the first page or so.

Economy:

The ISM services index (the big part of the US economy) for January was 52.5, up from 50.5 last month (anything over 50 shows growth). 

Geo-Political:

There is a lot going on politically in the US, but none with a major impact on our economy.

The Congressional Budget Office (CBO) released it review of the nation’s finances for the next ten years, and it is bad.  They project we will add $20 trillion to the US deficit over the next ten years, bringing the total debt of the govt. to $55 trillion by 2034.  The largest problem is going to be the growing interest on the debt now that interest rates are not at zero anymore.  Fixing a problem of that size will be painful, and our politicians show no inclination to inflict pain on their constituencies, so the problem continues to worsen.  The link below will bring you to their findings, if you are a masochist. 

https://www.cbo.gov/publication/59710

Last week we looked at Japan, but only their lengthy use of negative interest rates which failed to usher in prosperity to their island nation, the fourth largest economy in the world by GDP.

Clearly, negative interest rates are not the only aspect of Japan’s economy that makes them interesting.

Japan had much work to do to rebuild their nation following WW II.  By the 1970’s they were building good cars at Toyota, motorcycles at Honda, consumer electronics at Sony, cameras at Canon, and steel at Nippon Steel.  The Japanese companies cooperated with each other, blocking US companies from getting a foothold in their economy (look up “Japan Inc.” at Investopedia.com for more info).  They became powerhouses in global commerce.

The Japanese economic miracle peaked in 1989, a recession ensued in the 1990’s, which was called “the lost decade” in Japan.  Since then Japan has recovered and is still dominant in auto’s (Toyota in the #1 auto seller in the world), but they have lost ground in most other sectors.

Computer chips are the new hot economic sector in the world.  We have left the industrial age for the information age.  Japan is a factor in global information technology, but they are not as much a factor as they were in autos.  Taiwan is the leading producer of computer chips; they make 60% of the worlds chips and 90% of the most powerful chips through Taiwan Semiconductor.  South Korea ranks second in the world in chip production, mainly from Samsung Electronics.  Japan ranks third, China is fourth, and the US is fifth.  Samsung has taken a significant share of the consumer electronics business away from Sony.

It appears that Japan was so focused on excellence in autos that they missed the growing importance of computer chips. 

There are cultural issues in Japan, particularly workplace culture.  Most workers are expected to work long hours at the office, even if they are not accomplishing much after 5 PM.  There is pressure to “conform” to the corporate culture, and I wonder how much that stifles innovation.

Japan also has a very different demographic profile than other nations. 

From Wikipedia:

Apart from a small baby boom in the early 1970s, the crude birth rate in Japan has been declining since 1950, and is expected to be as low as 7.5 births per thousand people in 2020. With a falling birth rate and such a large share of its inhabitants reaching their later years, Japan’s total population is expected to continue declining

Japan’s population is aging faster than that of any other nation. The population of those 65 years or older roughly doubled in 24 years, from 7.1% of the population in 1970 to 14.1% in 1994. The same increase took 61 years in Italy, 85 years in Sweden, and 115 years in France. In 2014, 26% of Japan’s population was estimated to be 65 years or older, and the Health and Welfare Ministry has estimated that over-65s will account for 40% of the population by 2060. The demographic shift in Japan’s age profile has triggered concerns about the nation’s economic future and the viability of its welfare state.

One can wonder why the birth rate is so low in Japan, but things cost a lot there.  Having children is an economic hardship and it compounds with other problems for Japan.

Japan grinds along, a major player in the world economy, but not the economic miracle they appeared to be in the late 1980’s.

I am sure there are many books and studies about the Japanese economy and each aspect I called out, but that is beyond the scope of this blog.  Google is your friend if you want to learn more.

Technical Analysis:

For the week ending 2/09/2024, the S&P 500 was up 1.5%.

Technically (see chart below) the market looks positive, but extended.  RSI at the top of the chart is overbought at 73.  Momentum shown by MACD at the bottom of the chart is positive and rising.  The price action is positive, but extended on the upside, well above the top of the channel (upper purple line) and the 50 day moving average at 4750 (thin blue line).  The market needs a correction and eventually we will get one, but nobody knows when.  That sounds like a broken record (for those who know what a broken record sounds like!), but it’s the truth.  Trees don’t grow to the sky!

Click THIS LINK to open the chart in a separate window.

What am I doing?  What do you do when six stocks account for most of the markets gains and they are richly valued?  You can look elsewhere for a quality company that has taken a hit, maybe UNH.  People that deferred medical procedures during covid are getting those procedures done, and it is costing health insurance companies now, but eventually they will be caught up and their margins should return to normal.  I don’t think they are permanently broken, but it could take a year or two.  Another way is to buy into these six richly valued companies, understanding that buying an overbought stock is very risky.  You would need protection, which can be provided by a “trailing stop loss – percent” order.  If you have not used one, google it since it is a good order to understand.  The second method of protection is to buy a small amount of an overbought stock.  If it goes up, you make a little money, and if it goes down, they you can buy more and bring down your average cost basis in the stock.

One of the better values in the AI Five stocks (MSFT, NVDA, META, GOOG, AAPL) is GOOG.  The P/E ratio OF 26 is not out of sight like the others because it has not launched its AI offering yet.  That leaves a risk in that we don’t know what their AI offering will be, but they have had sufficient cash flow to fund development and their long term track record has been good.  They have done a couple of unimpressive demo’s of a Beta version of a possible product called Bard, which both had problems.  An investment in GOOG is a bet that they can fix the problems with Bard and come out with a competitive offering in consumer AI and that would justify a higher PE, line with the other major players.  That is the hope for GOOG (someone has said “hope is not a strategy”).  I added a little GOOG and sold a put option so I would add shares if the stock price falls sufficiently.

———————–  

If you enjoy these updates, please tell your friends and family who are interested in the stock market about this blog.

I would like to call your attention to a page of my blog called “CLASSICS”.  It is located at the top of the blog, on the banner just under the title.  The banner has links to “Home”, “About”, and now “Classics”.  These are articles that I wrote one time for the blog, but they are valuable insights at all times for investors.  I will announce in the weekly blog when I add a new classic.

There are currently 3 Classic topics posted:

  • Is it a bull market or a bear market?
  • Why does healthcare cost so much?
  • Implications of a large national debt. (posted August 2022)

Your comments and questions are always appreciated, so feel free to comment using the “Leave a Comment” feature just under the title of the post.

You can use the hyperlink below the chart of the S&P that will open a larger picture of the chart in a separate window.  The reader who suggested this wants to look at the chart side-by-side with the blog text.  If you bookmark the link to the chart you can look at it each day of the week to see how the market is progressing to certain milestones.  The picture in this post is a static .jpg so it does not update.

I am a retired person and preserving capital and seeking income are important objectives for me.  I also want a growth component to my portfolio, while minimizing major risk.  My style of investing will not suit everyone.  I like to sleep well at night.  Investing involves risk, including the risk of loss.

Rich Comeau, Rich Investing

Big Tech Knocks It Out the Ballpark

I update each Saturday with my view of the stock market for the next few weeks (if occupied with family or travel, rarely I am a day or two late, just check back).  The monthly “Long Term” update will be on the fourth Thursday of each month, and this supports investors who want to buy and hold, but want to sell to avoid the bulk of a primary bear market, and buy back in for most of the next bull market.

If you lose your bookmark to the blog, google “Rich Investing Blog” and it should show up on the first page or so.

Economy:

The Case Schiller home price index (20 cities) for Nov. was up 5.4% Y-o-Y, and that is too high.  Existing homes are not for sale as young homeowners cling to their 3% mortgage, and empty nesters look at selling their home which has gone up in value a lot, only to find that moving down to a smaller home with cost the same as what they have now.  There is no advantage to moving down for most.  Of course some homes turn over in special cases, but it is not the general case.  New home builders learned the lesson of having too large of an inventory, so they manage their inventory, keep the number of new homes for sale low, and that keeps the price high.  The new home builders do what good capitalists do, they maximize their profit. 

https://www.businessinsider.com/baby-boomers-wont-sell-homes-millennials-kids-need-housing-affordability-2024-1

The ISM manufacturing index for Jan. was 49.1, so it is still contracting a little.  Non-farm jobs for Jan. were up a large 353K, while the unemployment rate held steady at 3.7%.  Factory orders were up .2% in Dec.  The U. of Michigan consumer sentiment index was up a tad at 79.0.  US auto sales for Jan. were 15.0 million annualized, down from 16.1 million, but sales usually slow in the winter due to harsh weather.

Most of the economy is good and steady.  The surprise with how strong job creation is currently.  This took a March rate cut off the table, but Fed chairman Powell already told us that on Wed. Jan. 31.

Geo-Political:

The Fed meeting results were released on Wed. and they left rates unchanged again.  They are talking about when to begin lowering rates, but Jerome Powell said that a rate cut in March is not their base case and he considered it unlikely.  Powell said at the next Fed meeting they will begin to discuss when and how to reduce running off the Fed balance sheet, or QT.  They are still running off $90 billion per month, quite a high rate of bonds that the private market must absorb.

Over the years that I have posted on this blog, I have posted about our economy, the EU and England (an important US trading partner), and China.  These are the top three global economies measured by GDP, and it is important to keep an eye on our trading partners.  A few weeks ago I posted about India (#5 in GDP and the fastest growing economy), and now it is time to look at Japan, the #4 economy in the world.  It is pretty amazing that a nation with such a small land mass has such a large economy. 

The Japanese economy was the envy of the world in the 70’s and 80’s, exerting strength in major sectors of the world economy such as steel production, autos, and consumer electronics.  Their economy got overheated, people would pay any price for real estate, they got over-leveraged, and in 1989 things broke down and a major recession occurred.  They have not returned to levels of stable growth since.  This is a long article, but it is an important look at the impact of long term negative interest rates, which Japan has maintained since 2016.

Why Negative Interest Rates Are Still Not Working in Japan      Updated October 15, 2023

The Bank of Japan (BOJ) keeps trying to print Japan back to economic prosperity, and it is not letting more than 25 years of failed stimulus policies get in its way. The BOJ announced negative interest rates in January 2016 as an iteration in monetary experimentation. Six months later, the Japanese economy showed no growth, and its bond market was a mess. Conditions deteriorated so far that the Bank of Tokyo-Mitsubishi UFJ Ltd., Japan’s largest private bank, announced in June 2016 that it wanted to leave the Japanese bond markets because BOJ interventions had made them unstable.

While these economic woes presented major problems for then-prime minister Yoshihide Suga and then-BOJ Governor Haruhiko Kuroda, they can serve as a cautionary tale for the rest of the world. Chronically low interest rates and huge monetary expansions failed to promote real economic growth in Japan. Quantitative easing (QE) did not achieve its stated objectives in the United States or the European Union (EU), nor have chronically low interest rates been able to revive Japan’s once-thriving economy.

Why Japan Went Negative

There are two reasons why central banks impose artificially low interest rates. The first reason is to encourage borrowing, spending, and investment. Modern central banks operate under the assumption that savings are pernicious unless they immediately translate into new business investment. When interest rates drop to near zero, the central bank wants the public to take their money out of savings accounts and either spend it or invest it. This is based on the circular flow of income model and the paradox of thrift. Negative interest rate policy (NIRP) is a last-ditch attempt to generate spending, investment, and modest inflation.

The second reason for adopting low interest rates is much more practical and far less advertised. When national governments are in severe debt, low interest rates make it easier to afford interest payments. An ineffective low-rate policy from a central bank often follows years of deficit spending by a central government.

No country has proven less effective with low-interest-rate policies or high national debt than Japan. By the time the BOJ announced its NIRP, the Japanese government’s rate was well over 200% of gross domestic product (GDP).

Japan’s debt woes began in the early 1990s, after Japanese real estate and stock market bubbles burst and caused a steep recession. Over the next decade, the BOJ cut interest rates from 6% to 0.25%, and the Japanese government tried nine separate fiscal stimulus packages.

The BOJ deployed its first quantitative easing in 1997, another round between 2001 and 2004, and quantitative and qualitative monetary easing (QQE) in 2013. Despite these efforts, Japan had almost no economic growth for more than 25 years.

Why Negative Interest Rates Do Not Work

The Bank of Japan is not alone. Central banks have tried negative rates on reserve deposits in Sweden, Switzerland, Denmark, and the EU.5 As of July 2016, none had measurably improved economic performance.

The World Bank. “Policy Research Working Paper 7791, Negative Interest Rate Policies Sources and Implications 2016.

The U.S. later followed suit, bringing interest rates to the 0% to 0.25% range in March 2020 in response to the pandemic, but rapidly hiking them again once the crisis was over.

Globally, there was more than $12 trillion in government bonds trading at negative rates as of 2020.

Low interest rates are designed to warm up the economy, increase spending and investing, and encourage borrowing. But super-low interest rates do little for indebted governments, and even less to make businesses more productive or to help low-income households afford more goods and services. Super-low interest rates do not improve the capital stock or improve education and training for labor. Negative interest rates might incentivize banks to withdraw reserve deposits, but they do not create any more creditworthy borrowers or attractive business investments.

Japan’s NIRP certainly did not make asset markets more rational. By May 2016, the BOJ was a top 10 shareholder in 90% of the stocks listed on the Nikkei 225.8

Does Japan Still Have Negative Interest Rates?

Japan was still operating with negative interest rates as of September 2023, but most economists predict that could end in 2024, according to a Reuters poll.

Why Didn’t QE Work In Japan?

Some experts consider Japan’s over-reliance on interest rates as a monetary tool and the fact that QE did not put more money into the hands of its residents and non-bank companies as two reasons why QE failed to juice economic growth as desired.

Why Isn’t Japan Increasing Interest Rates?

Even as the U.S. and other countries raised their interest rates beginning in March 2022, the Bank of Japan decided to stay the course, keeping rates below zero throughout 2022 and 2023. Japan’s thinking for this decision was that for such a fragile economy, with weak demand to begin with, raising rates would only endanger any hard-won growth and make it more difficult for the country to service its debt.

The Bottom Line

There appears to be a disconnect between standard macroeconomic theory, by which borrowers, investors, and business managers react fluidly to monetary policy, and the real world. The historical record does not kindly reflect governments and banks that have tried to print and manipulate money into prosperity. This may be because currency, as a commodity, does not generate an increased standard of living. Only more and better goods and services can do this, and it’s clear that circulating more bills is not the best way to make more or better things.”

https://www.investopedia.com/articles/markets/080716/why-negative-interest-rates-are-still-not-working-japan.asp

Donald Trump tried to pressure our Federal Reserve to drop to negative interest rates in 2019, while Europe and Japan used that policy.  It would have been wrong for the US, and thankfully Jerome Powell as Fed Chairman did not listen to Trump.  The value of an independent Fed, beyond the control of politicians is apparent.

Nov. 18, 2019 – Presidents often meet with Fed chairs to discuss the economy. But the stakes are much higher when the backdrop is Trump’s blunt personal attacks on the Fed and its chairman — a step no previous president has taken. The independence of the Fed has long been considered vital to its mandate of keeping prices stable and maximizing employment.

Trump has complained that negative rates, which have been put in place by the European Central Bank and the Bank of Japan, have left the United States at a competitive disadvantage. The Fed’s benchmark rate is currently in a range of 1.5% to 1.75%, an extremely low level by historic standards, particularly given that the unemployment rate is near a 50-year low of 3.6%.

In a speech last week, Trump said, referring to negative interest, “Give me some of that…. I want some of that money. Our Federal Reserve doesn’t let us do it.”

The Fed’s relatively high benchmark rate, compared with the negative rates overseas, probably does keep the dollar at a higher value compared with the euro and yen. That, in turn, can make U.S. exports more expensive overseas.

Still, the vast majority of mainstream economists oppose the notion of deploying negative rates for the U.S. economy, which is healthier and is growing faster than its European and Japanese counterparts.

Negative rates are typically a sign that an economy is struggling. Many U.S. economists have expressed skepticism that negative rates help accelerate growth and argue that they would cause problems unique to the U.S. financial markets.”

https://www.cbsnews.com/news/trump-powell-meeting-president-and-fed-chairman-meet-at-white-house-to-talk-interest-rates

Trump tried to pressure Powell to adopt an unwise policy that has failed in Japan for the long term, it was ineffective in Europe over the last decade, the US was out-performing both of those economies and it still is to this day.  Thankfully Powell had the independence of the Fed and he rejected Trump’s desire to implement negative interest rates.

Technical Analysis:

For the week ending 2/02/2024, the S&P 500 was up about 1.2%.

Technically (see chart below) the market looks positive, and over extended.  RSI at the top of the chart is overbought and rising at 70.  Momentum shown by MACD at the bottom of the chart is rising slightly.  The price action is positive, but extended well above the top of the channel and the 50 day moving average. 

Last week was great with Big Tech beating earnings estimates and showing impressive year over year growth rates.  Now we get to regular companies, not in the Mag 6, and it will be interesting to see how their earnings are.

Here is the latest read on earnings for Q4:

“NEW YORK, Feb 2 (Reuters) – The U.S. fourth-quarter earnings estimate is improving sharply, with about 80% of reports so far beating analysts’ expectations including ones this week from Meta Platforms and Amazon.com, according to LSEG data on Friday.

Overall S&P 500 earnings now are expected to have increased 7.8% in the fourth quarter from the year-ago quarter.

That is up from a 6.4% estimate on Thursday and 4.7% at the start of the year, the data showed.”

What will be interesting to watch is whether the rest of the S&P yet to report can keep pace with the MAG 6.

Click THIS LINK to open the chart in a separate window.

What am I doing?  With stocks at record highs, it’s a good time to sell covered calls.  I had bought a “little” bit of the Mag 6 stocks and I sold them after the earnings pop.  MRNA is down so I will look at selling a Put.

———————–  

If you enjoy these updates, please tell your friends and family who are interested in the stock market about this blog.

I would like to call your attention to a page of my blog called “CLASSICS”.  It is located at the top of the blog, on the banner just under the title.  The banner has links to “Home”, “About”, and now “Classics”.  These are articles that I wrote one time for the blog, but they are valuable insights at all times for investors.  I will announce in the weekly blog when I add a new classic.

There are currently 3 Classic topics posted:

  • Is it a bull market or a bear market?
  • Why does healthcare cost so much?
  • Implications of a large national debt. (posted August 2022)

Your comments and questions are always appreciated, so feel free to comment using the “Leave a Comment” feature just under the title of the post.

You can use the hyperlink below the chart of the S&P that will open a larger picture of the chart in a separate window.  The reader who suggested this wants to look at the chart side-by-side with the blog text.  If you bookmark the link to the chart you can look at it each day of the week to see how the market is progressing to certain milestones.  The picture in this post is a static .jpg so it does not update.

I am a retired person and preserving capital and seeking income are important objectives for me.  I also want a growth component to my portfolio, while minimizing major risk.  My style of investing will not suit everyone.  I like to sleep well at night.  Investing involves risk, including the risk of loss.

Rich Comeau, Rich Investing