I update each Saturday with my view of the stock market for the next few weeks (if occupied with family or travel, rarely I am a day or two late, just check back). The monthly “Long Term” update will be on the fourth Thursday of each month, and this supports investors who want to buy and hold, but want to sell to avoid the bulk of a primary bear market, and buy back in for most of the next bull market.
If you lose your bookmark to the blog, google “Rich Investing Blog” and it should show up on the first page or so.
The monthly Long Term update will be posted on Thursday 4/25.
Economy:
Retail sales for March rose .7%. Existing home sales for March were 4.2 million units annualized, down from 4.4 million last month. That looks poor considering we have entered the spring selling season. High home prices, limited supply and high interest rates make the market tough for those who can’t pay cash. The leading economic indicators (LEI) for March were -.3% after last month’s +.2% broke the year long trend of negative readings, so its back to negative.
Mixed data this week, call it a push (a push in betting is a tie, nobody wins, nobody loses).
Geo-Political:
The topic of the week was the clash between Israel and Iran. Iran fired 300 missiles at Israel last weekend which Israel, the US and Jordan shot down, and Israel struck back in a limited way at a military base in Iran. The stock market priced in a geo-political risk event, and we hope it does not go farther. We’ll see.
A friend asked me a couple of weeks ago, what was wrong with a particular company whose stock was so high in 2021 and it has come down so low today? 2021 was a “cash infusion cycle” bull market high, when both Trump and Biden had been pumping trillions of dollars into the economy like drunken sailors. Stock prices had boomed to obscene valuations on a PE basis. That had to be corrected and it was by the 2022 bear market. I told my friend, there was nothing wrong with the company. Stupid investors drove the stock price up far beyond historical measures, and that does not stand forever. It may take a year or two, but it will be corrected. We are seeing that correction in the Mag 7 stocks now, although TSLA looks more like a broken stock than a correction.
Technical Analysis:
For the week ending 4/19/2024, the S&P 500 was down about 2.5%, down every day.
We are 5% below the market’s all-time high. We are in a bull market correction.
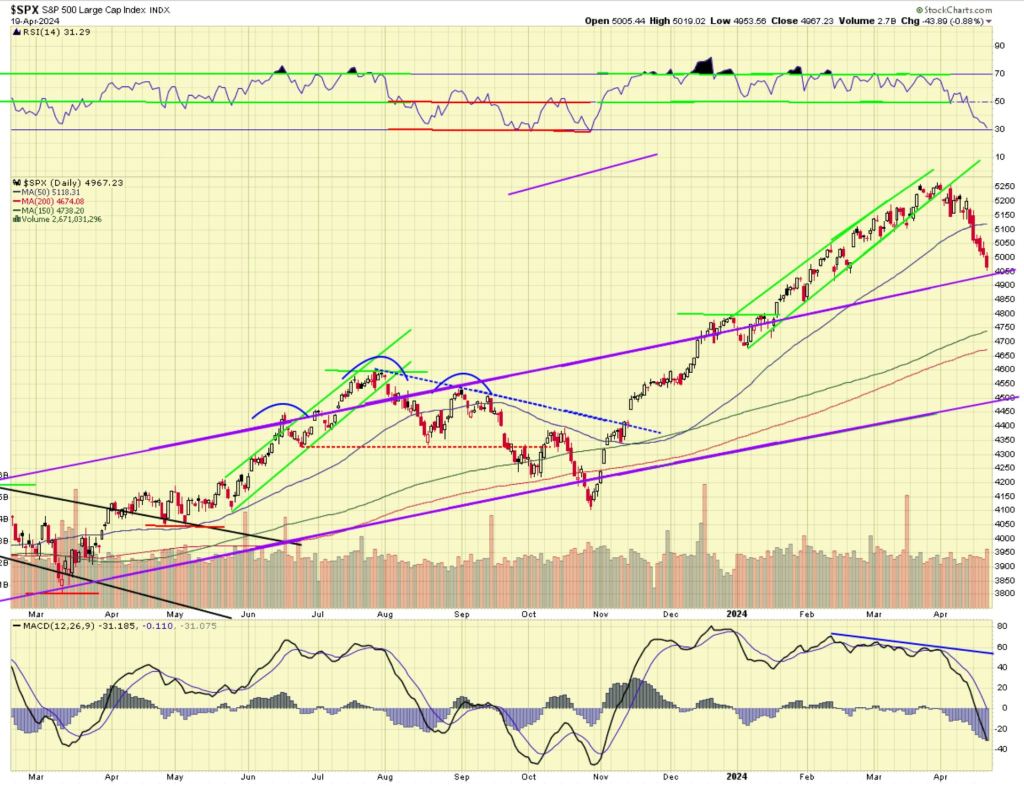
Technically (see chart below) the market looks negative near term and positive long term. RSI at the top of the chart is oversold at 31, so it may be time to think about buying a little. Momentum shown by MACD at the bottom of the chart is negative and the decline has picked up pace.. The price action is negative.
It is interesting to look at the RSI at the top of the chart. I have color coded the bullish and corrective areas in green and red. In a bull market when the market becomes overbought (RSI at or above 70), it can stay overbought for weeks or even months. In a bull market, when the market becomes oversold (RSI at or below 30), the market seldom stays oversold for long. You can see that over the last year. The behavior of the RSI tells you a lot about the complexion of the market. We are oversold. Will we rally? I suspect we will unless a major geo-political event occurs that scares the market. When we rally, if the rally ends with a high that is below the March peak at 5250, that would be a lower high and we could begin to build a down channel which would indicate the correction has farther to go.
There is a good support zone between the 150 and 200 day moving averages, from 4650 to 4750. If that is not held, the bottom of the normal range, the two purple lines, would provide support at 4500.
Click THIS LINK to open the chart in a separate window.
What am I doing? I was assigned on a PLTR Put at $21 so I now own more. I had sold a Put option at a strike of 21 and the stock closed at 20.50. If the holder of my Put option did not own any PLTR stock, he could exercise his option to put the shares to me at 21, go on the open market and buy them at 20.50 and force me to buy them at 21, so he made .50 per share gross profit. The stock is low priced, so he probably bought my option for .25, then he got .50 by selling me the shares, so he doubled his money over a month or two. If the stock had closed at 21.05 instead, the holder of my Put option would not have exercised, and he would have lost the .25 per share that he paid me for the option, so he would have suffered a 100% loss in that case. All option contracts cover 100 shares of the stock. So if the option holder paid .25 per share for the option, he controlled 100 shares of PLTR for $25, which would have been his total loss. The option game is a little complicated because it involves selecting a strike price where you think you will make money, and a specific expiration date of the contract, so there are a few important moving parts you have to deal with.
I had a few stocks called away, XOM, SCHW, and RTX, all at nice profits. That is one of the risks of selling covered calls, you may have the stock called away if it goes up in price above the strike price at which you sold the call option. I will keep an eye on them to see if I can buy them back at a lower price. Some stocks held up well or went up during this correction.
With stocks on sale, I started to do a little buying, little being the operative word. I bought a little AMGN, BMY, MSFT UNH and C. For expensive stocks I started a position with only 10 shares. They may all continue to fall and I may be able to add more shares at a lower cost if this correction continues. I don’t simply look at the S&P chart when buying a stock, you also have to look at the chart of the stock itself. If the market has come down but the stock has not come down as much, it may not be a good time to buy that stock. I also check the recent news on a stock at Finviz.com, and the latest earnings report. Fidelity provides for free several good rating service reviews from companies like Zach’s and I look for their overall rating on the company.
———————–
If you enjoy these updates, please tell your friends and family who are interested in the stock market about this blog.
I would like to call your attention to a page of my blog called “CLASSICS”. It is located at the top of the blog, on the banner just under the title. The banner has links to “Home”, “About”, and now “Classics”. These are articles that I wrote one time for the blog, but they are valuable insights at all times for investors. I will announce in the weekly blog when I add a new classic.
There are currently 3 Classic topics posted:
- Is it a bull market or a bear market?
- Why does healthcare cost so much?
- Implications of a large national debt. (posted August 2022)
Your comments and questions are always appreciated, so feel free to comment using the “Leave a Comment” feature just under the title of the post.
You can use the hyperlink below the chart of the S&P that will open a larger picture of the chart in a separate window. The reader who suggested this wants to look at the chart side-by-side with the blog text. If you bookmark the link to the chart you can look at it each day of the week to see how the market is progressing to certain milestones. The picture in this post is a static .jpg so it does not update.
I am a retired person and preserving capital and seeking income are important objectives for me. I also want a growth component to my portfolio, while minimizing major risk. My style of investing will not suit everyone. I like to sleep well at night. Investing involves risk, including the risk of loss.
Rich Comeau, Rich Investing
