I update each Saturday with my view of the stock market for the next few weeks (if occupied with family or travel, rarely I am a day or two late, just check back). The monthly “Long Term” update will be on a Wednesday soon after the 15th of each month, and this supports investors who want to buy and hold, but want to sell to avoid the bulk of a primary bear market, and buy back in for most of the next bull market. You can always scroll down a few weeks and find the latest “Long Term” update.
If you lose your bookmark to the blog, google “Rich Investing” and it should show up on the first page or so. The more often you google it and hit the link, the higher it will show in your results.
The monthly Long Term update was posted Wednesday and is just below this one, so if interested just keep scrolling down from the bottom of this one.
Economy:
Initial jobless claims fell by 6,000 to 216,000 in the seven days ended June 15 to a stable and generally low level. The leading economic index (LEI) had risen three months in a row before recording a zero level for May, which is another indicator of slower economic growth. Existing-home sales were at a 5.34 million seasonally adjusted annual pace in May, 2.5% higher than in April, but 1.1% lower than a year ago.
Below is a paragraph with IHS Market PMI surveys for both manufacturing (smaller part of the US economy) and services (larger part of the economy). I am pointing this out because I usually only report the ISM PMI numbers, but since this set came out first and it is risky, I thought I should report it as soon as available. I will continue to report the ISM numbers in the future, unless there is a special reason to report both sets.
IHS Markit said its flash manufacturing purchasing managers index dropped to 50.1 in June from 50.5 in May, the worst reading since September 2009. The flash services purchasing managers index in June fell to 50.7 from 50.9, the worst reading since March 2016. Any reading above 50 indicates improving conditions. The flash estimate is typically based on approximately 85%–90% of total survey responses each month and the final report for the month comes out a few weeks later. What happened: Private-sector output growth has lost momentum in each month since February, IHS Markit said.
Home sales are responding positively to falling interest rates driven by the bond market but not matched by the Fed yet. The LEI has been positive but weak for months and dropped to zero, not a good sign, but it has recovered from dips like this. The weakness in the PMI numbers is very concerning, showing that manufacturing is stalling and services is weak but still growing. This is what has bond traders calling for a Fed rate cut, but with the economy showing slow growth it would be a “pre-emptive” rate cut, not based on actual economic performance, but a rate cut to hopefully keep the economy from falling into recession. One has to wonder if a quarter point cut at this point could overcome global slowing and concerns over the trade war. International business is slow to make decisions about rebuilding supply chains until a final deal is reached with China, because they don’t know what they are dealing with.
Geo-Political:
Today we will focus on the results of the Fed meeting in the week just ended. This is from the Fed statement:
The Committee continues to view sustained expansion of economic activity, strong labor market conditions, and inflation near the Committee’s symmetric 2 percent objective as the most likely outcomes, but uncertainties about this outlook have increased. In light of these uncertainties and muted inflation pressures, the Committee will closely monitor the implications of incoming information for the economic outlook and will act as appropriate to sustain the expansion, with a strong labor market and inflation near its symmetric 2 percent objective.
The stock market liked the statement. The Fed removed the word “patient”, which meant they did not see any need to cut rates, and changed it to “closely monitor” and “act as appropriate to sustain the expansion”, which means they are poised to cut if necessary.
The June rally was started on June 4th, by Fed Chairman Powell’s statement at a speech that was nearly identical to that released by the Fed this week.
June 4, 2019 – CHICAGO — The Federal Reserve chairman, Jerome H. Powell, said on Tuesday that the central bank was prepared to act to sustain the economic expansion if President Trump’s trade war weakened the economy. His remarks sent stocks soaring as investors predicted a cut in interest rates.
“We do not know how or when these issues will be resolved,” Mr. Powell said of the United States’ trade disputes with Mexico, China and other nations. “We are closely monitoring the implications of these developments for the U.S. economic outlook and, as always, we will act as appropriate to sustain the expansion, with a strong labor market and inflation near our symmetric 2 percent objective.”
https://www.nytimes.com/2019/06/04/business/economy/powell-fed-trade-wars.html
Earnings are lackluster, and the market is being primarily driven by statements from the Fed. That is not the way things are supposed to work, the market is supposed to be driven by earnings. That tells me there is risk out in the market.
Technical Analysis:
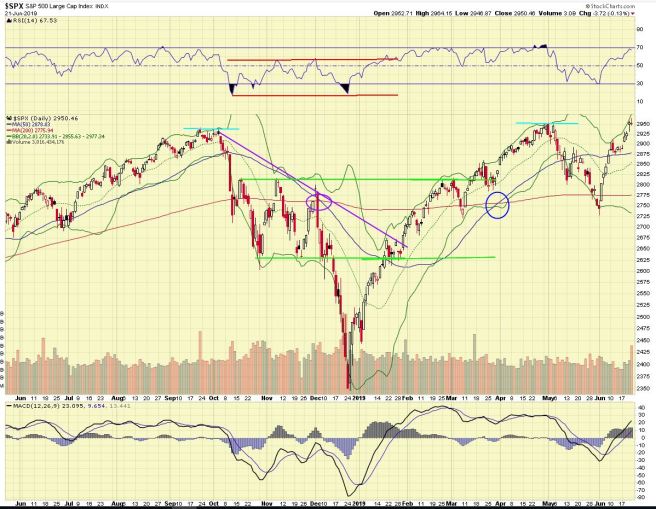
The S&P set a record closing high on Thursday at 2954, after Fed Chairman Powell indicated the Fed was open to a rate cut if necessary to sustain the economic expansion. The market has been rallying since June 4th when Powell initially made those comments in an informal speech.
Technically, the market looks good sitting at an all-time high. RSI at the top of the chart moved up and closed at a short term overbought level of 69. Short term the momentum is positive shown by MACD at the bottom of the chart. The price action is clearly positive, rising sharply since June 4. It is a concern that we have moved up to fully overbought on the RSI since in the last year we have not remained overbought once we have hit that level. This bull market is old and looks weak. Let’s watch, but a correction could start at any time. A second concern from the chart is that this record high COULD be part of a triple top formation, going back to Oct., May, and now. This remains to be seen what happens. The market could continue up through this resistance level and be off to the races. I don’t see it that way as there are so many concerns in the real world like the trade disputes and lackluster forecast earnings for Q2. But, if it did turn out to be a large multi-month triple top, then we could be in for a sizable correction. We’ll just have to wait and see.
Click THIS LINK to open the chart in a separate window.
The G20 meeting is this week in Osaka Japan, 6/28-29. Trump and President Xi of China are scheduled to meet but no agreement will likely be reached. The US has been threatening to add a new tariff to Chinese goods, 10% on an additional $300 billion of goods, and that would show up soon in many US consumer goods. The best news that could come out of the meeting would be that Trump says China indicates flexibility in terms and the new tariffs are postponed. The market would like that statement, if it comes about. But on May 15, Trump added Huawei to the “Entity List” by Executive Order, banning US corporations from importing Huawei products. That is a huge hit to China’s largest electronics producer, and a major escalation of the trade war. Just how much flexibility do you think President Xi will be willing to offer? I don’t think he will offer any flexibility unless the US offers something big, like taking Huawei off the entity list. Let’s see. If no good news comes out of Trump’s meeting with Xi, the market could sell off.
What am I doing? Friday was an options expriation for me and I kept the premium I collected when I sold Put options on Boeing and Exxon. I also had covered calls expire on AMD at 30 and MLCO. I had my MRK called away at 83 for a nice profit and if the market gets hit I will look to buy it back. I started a small position in CSCO and will look to buy more on a pullback.
If you enjoy these updates, please tell your friends and family who are interested in the stock market about this blog.
Your comments and questions are always appreciated, so feel free to comment using the “Leave a Comment” feature just under the title of the post, or send me an email, my address is on the “About” page at the top of the blog.
You can use the hyperlink below the chart of the S&P that will open a larger picture of the chart in a separate window. The reader who suggested this wants to look at the chart side-by-side with the blog text so he can look at the chart while reading the text. To do this in Firefox you can open a “private window” from the browser menu and have two instances of Firefox up, then size each window to about half of your monitor size. If you bookmark the link to the chart you can look at it each day of the week to see how the market is progressing to certain milestones. The picture in this post is a static .jpg so it does not update, but if you bookmark the link to the live chart on stockcharts and look at that daily, it does update.
Rich Comeau, Rich Investing
