I update each Saturday with my view of the stock market for the next few weeks (if occupied with family or travel, rarely I am a day or two late, just check back). The monthly “Long Term” update will be on the first Wednesday of each month, and this supports investors who want to buy and hold, but want to sell to avoid the bulk of a primary bear market, and buy back in for most of the next bull market.
If you lose your bookmark to the blog, google “Rich Investing Blog” and it should show up on the first page or so.
This is the post for the week (Wednesday 6/26), there will be no post on Saturday.
Economy:
The Case Schiller home price index of 20 cities was up in April Y-o-Y, 7.2%, too high. The Conference Board consumer confidence index slipped very slightly in June to 100.4, buoyed by confidence in the labor market. New home sales in May were 619K annualized, down substantially from April.
Friday June 28th will see PCE reported for the month, which is the inflation guage the Fed favors, so keep an eye out for that on Friday.
This glimpse of the economy shows it remains sluggish, which is required to bring inflation down. Inflation in home prices is still too high.
Geo-Political:
Today, a quick look at Europe:
“May 20th 2024 – There is only one problem with chatter about Europe’s “soft landing”: its economy never truly flew. Whereas America’s growth has consistently amazed, Europe’s has been miserable. Exclude Ireland, where statistics are distorted by multinational firms minimising tax, and the EU’s GDP has risen by about 3% since 2019, compared with a 9% increase in America.
Yet Europe’s outlook is undoubtedly improving. Data published on May 15th show that the euro zone grew by 0.3% in the first quarter of this year against the previous quarter. This was the first significant growth in six consecutive quarters and enough for the currency bloc to emerge from a recession. The same day the European Commission upgraded its forecasts for EU growth. “We believe we have turned a corner,” cheered a commissioner.”
The rest of the article requires a subscription. A healthier Europe will be a better trading partner and support the US economy.
Technical Analysis:
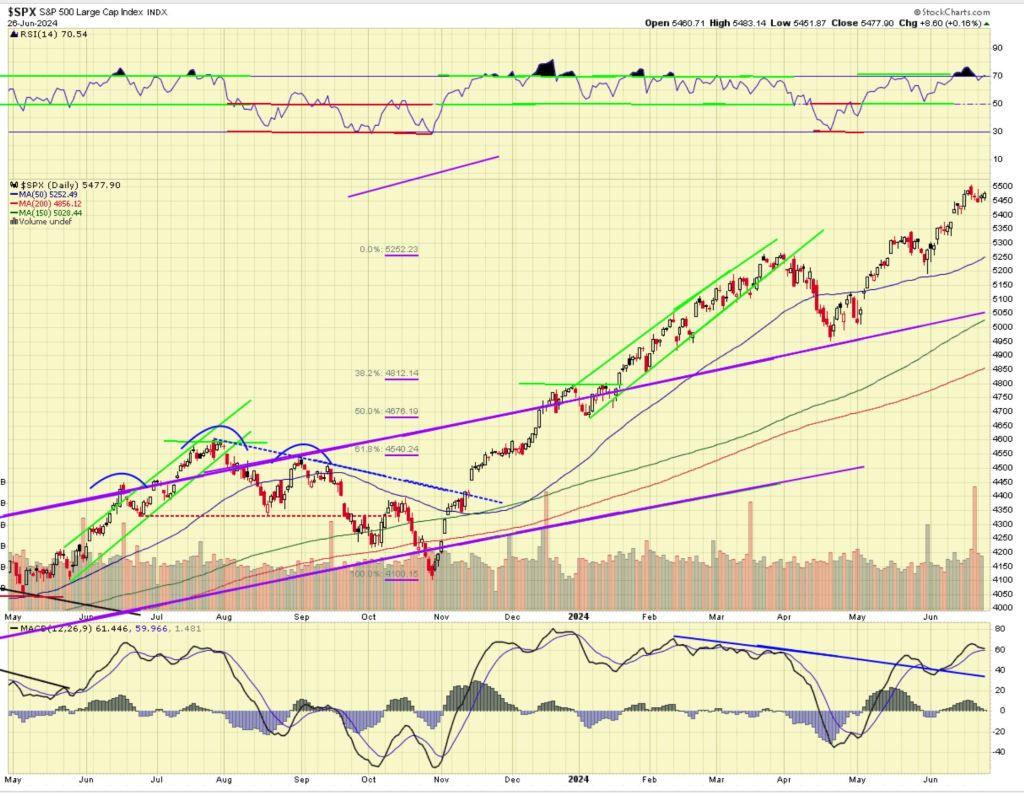
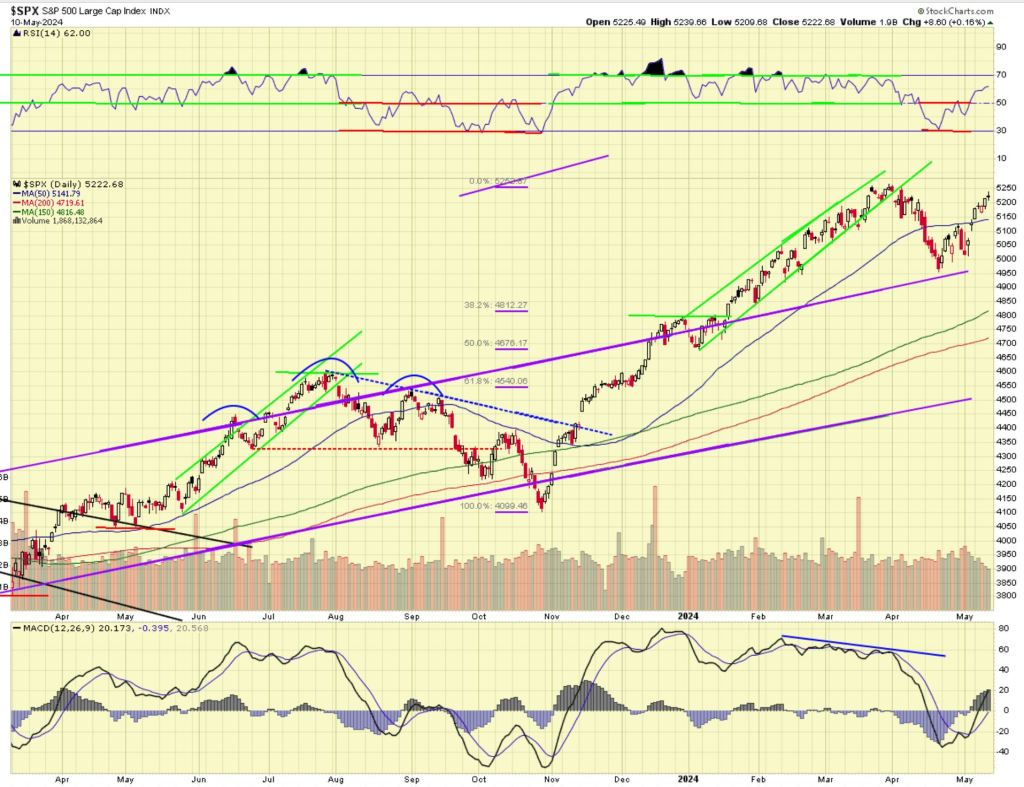
For the mid-week ending 6/26/2024, the S&P 500 was basically flat.
Technically (see chart below) the market looks positive. RSI at the top of the chart is overbought at 70 and steady. Momentum shown by MACD at the bottom of the chart is neutral and moving sideways and the histograms have shrunk to zero which is neutral (the histograms represent the distance between the two lines, the two moving averages). The price action is positive.
We’re in a bull market, and in a bull market when it gets overbought it can get more overbought. But it also has the risk of a correction from overbought.
What am I doing? I was looking for some things to sell near the all-time high. I took a short term profit in TOST, which sells a restaurant point of sale system that is gaining popularity. TOST is near its 52-week high. I bought a little MRNA which has corrected 25% after it ran up on some good news about a drug trial, but the product is probably 2 years from FDA approval. I reported in late May that I sold MRNA on the run-up. When a drug company pops up because of a successful trial, but other trials lie ahead and no revenue will come from that drug for a long time, I sell on the pop and will buy back on the drop. MRNA may not be finished correcting down. If the market goes into a general correction, MRNA would probably go lower with the market. So, I just bought a little and if the market corrects and MRNA corrects some more, I will buy more at the lower price.
———————–
I would like to call your attention to a page of my blog called “CLASSICS”. It is located at the top of the blog, on the banner just under the title. The banner has links to “Home”, “About”, and now “Classics”. These are articles that I wrote one time for the blog, but they are valuable insights at all times for investors.
There are currently 3 Classic topics posted: 1) Is it a bull market or a bear market? 2) Why does healthcare cost so much? and 3) Implications of a large national debt. (posted August 2022)
You can use the hyperlink below the chart of the S&P that will open a larger picture of the chart in a separate window. If you bookmark the link to the chart you can look at it each day of the week to see how the market is progressing to certain milestones. The picture in this post is a static .jpg so it does not update.
I am a retired person and preserving capital and seeking income are important objectives for me. I also want a growth component to my portfolio, while minimizing major risk. My style of investing will not suit everyone. I like to sleep well at night. Investing involves risk, including the risk of loss.
I update each Saturday with my view of the stock market for the next few weeks (if occupied with family or travel, rarely I am a day or two late, just check back). The monthly “Long Term” update will be on the first Wednesday of each month, and this supports investors who want to buy and hold, but want to sell to avoid the bulk of a primary bear market, and buy back in for most of the next bull market.
If you lose your bookmark to the blog, google “Rich Investing Blog” and it should show up on the first page or so.
Economy:
Retail sales for May were up .1%, weak. Existing home sales for May were 4.1 million annualized, compared to a 5 year average of 5 million, so its light. The Leading Economic Indicators (LEI) for May were -.5%, continuing a long string of declines.
The median apartment rent in the US was up 1.1% year over year in April, but there are several big cities where rental rates are falling due to past overbuilding.
“The median asking rent in Seattle fell 7.3% year over year in April—the biggest drop among the U.S. metros Redfin analyzed. Next came Austin, TX (-6.6%), Nashville, TN (-5.9%), Jacksonville, FL (-5.6%), Miami (-5%), San Diego (-4.7%), Phoenix (-4.6%), Charlotte, NC (-4.5%), Tampa, FL (-4.3%) and Orlando, FL (-3.2%).”
The economy looks sluggish, which is what the Fed wants to slow inflation, sluggish but not recessionary.
Geo-Political:
Let’s take a look at Russia today; we have not in quite a while. The article is from CEPA, the Center for European Policy Analysis in Washington DC. I am not familiar with them so there may be other views on the Russian economy today, but this one looked interesting:
——————————————–
“May 14, 2024 – The Russian economy is doing well. Vladimir Putin has repeatedly boasted about all-time low unemployment, real wage growth, and stable inflation. Confronted by an economically near-stagnant Western Europe and the failure of harsh predictions for Russia at the start of its all-out war on Ukraine, this unexpected affluence has provided a bonus for Putin in the hearts and wallets of the Russians. For now, at least.
The main driver of economic growth is gargantuan war-related state expenditure. For the first time in modern history, the country is set to spend 6% of gross domestic product (GDP) on the military this year, and defense outlays will exceed social spending.
In addition, there are also substantial state disbursements on other war-related items — like construction in the occupied territories of Ukraine, mortgage subsidies to war veterans and defense sector workers, and domestic production of hitherto imported goods. Overall, expenditure is planned to reach 36.6 trillion rubles ($401bn) in 2024 (a 26.2% annual rise.)
This spending frenzy is funded partly by oil revenue, which Western sanctions failed to stanch. It’s also supported by increased tax collection, driven by higher economic activity. While both are rising, spending can be sustained, which aids the economy. Supported by fiscal outlays, meanwhile, the war industry is at full throttle. But therein lies the rub.
Military factories, barely working just five years ago, are running around the clock and constantly need workers. In this, they must compete with other industries and the army, which is constantly offering higher-paying contracts. No wonder salaries are increasing not only in the military sector but across the board.
A more granular analysis shows that the wages are rising above average in those regions with a heavier bias toward military production and construction, and with a higher share of contract soldiers. Growth is highest in the lower-to-middle-income parts of society, reflecting a constant competition for workers and soldiers.
However, rising demand for labor intersects with declining supply. Labor availability has been sapped by the military draft, emigration, and restrictions on Central Asian workers after the Crocus Concert Hall terrorist attack in Moscow in March. As a result, unemployment is setting new historic lows every month.
It is a basic tenet of economics that unemployment and inflation have an inverse relationship; higher inflation is associated with lower unemployment and vice versa. The so-called Phillips curve shows that at a certain point, even a tiny drop in unemployment results in a sharp rise in inflation.
Historically, the optimal level of unemployment for Russia, the level at which the economy runs at full capacity without overheating and causing a spike in inflation, is around 4%. In March, it was 2.7%, compared to the average of 5.1% in the decade up to 2022.
If productivity was rising, optimal unemployment would have declined, as it did in the 2000s, when Putin was still in the business of pursuing liberal economic reforms and sponsoring infrastructure projects. However, the Kremlin now pours money not into new roads or cutting-edge machinery, but into tanks and missiles.
The result has been that productivity suffered a profound decline in 2022 (just a notch better than in 2009, the year of the global financial crisis.) The Kremlin needs to fix this to make growth more sustainable
It also explains why inflation is running at twice the central bank’s target and refuses to abate despite a prohibitive 16% base rate.
Inflation and high interest rates act as additional taxes on low-income Russians, who need to spend a greater share of their incomes on basic goods and services and cannot borrow to cover declining real incomes. The state is thus forced to raise salaries and payouts for the disadvantaged to maintain social support, further fueling inflation. The state also subsidizes loans and mortgages for some social groups, notably those involved in the war effort, which further divides society into winners and losers.
Foreign investment could have mitigated some of this in better times, but it’s out of the question now. It might also be an option to increase the supply of workers from Central Asia, but with the war going on and anti-immigrant sentiments high, that’s also impossible.
The Kremlin, as a result, is in a three-way bind of its own making. The government can’t cut spending as long as the war continues. The war, however, saps the labor force, fueling inflation and diminishing both welfare and public sentiment. And high interest rates, necessitated by all that inflation, stifle investment in productivity and further distort the economy.
To be clear, Putin can keep this juggling act going for a while longer. Oil sales are keeping the budget sound enough (sales in April alone doubled to $14bn year-on-year), while military spending is still much lower as a share of GDP than in the USSR, and state capitalism remains much more efficient than late socialism. However, with every tick of the clock, Russia’s wartime economy becomes more susceptible to external (or internal, for that matter) shocks.”
———————————-
There is a lot of good basic economic theory in the article, which is taking place in Russia today.
The Russian economy is doing better than I expected because despite US and European sanctions, China, N. Korea, and India will buy their discounted oil and keep their economy running. But inflation is high due to labor shortages. The US experienced high inflation in the 1970’s, partially due to winding down the government’s spending on the Vietnam war, and of course the two oil embargos by Saudi Arabia caused a spike in energy costs that rippled through the economy. Russia will eventually have to face that transition when the war in Ukraine ends. Putin will keep the war going until after the presidential election because he thinks he will get better terms for ending the war if Trump wins.
This is an unusual war because Ukraine does not have a military capability to attack Russia on their own. They get their long range weapons from the US and other NATO countries, and those weapons come with restrictions not to be used deep in Russia. The US does not want to provoke an attack on US shipping by Russia in retaliation for a Ukrainian attack on Russia using US weapons. Ukraine does not have the ability to destroy resources inside Russia, so Russia can continue to prosecute the war with relative impunity from military attack, except within Ukraine. Russia has little incentive to end the war, except for the calculus about what they are spending vs. what they may achieve in the end. The US and NATO allies want to make that look as unfavorable to Russia as possible so they will choose to end the war, but clearly Putin is stubborn. Putin wants to “save face”.
I am sure there are other views on the status of the Russian economy so look around if you are interested.
Technical Analysis:
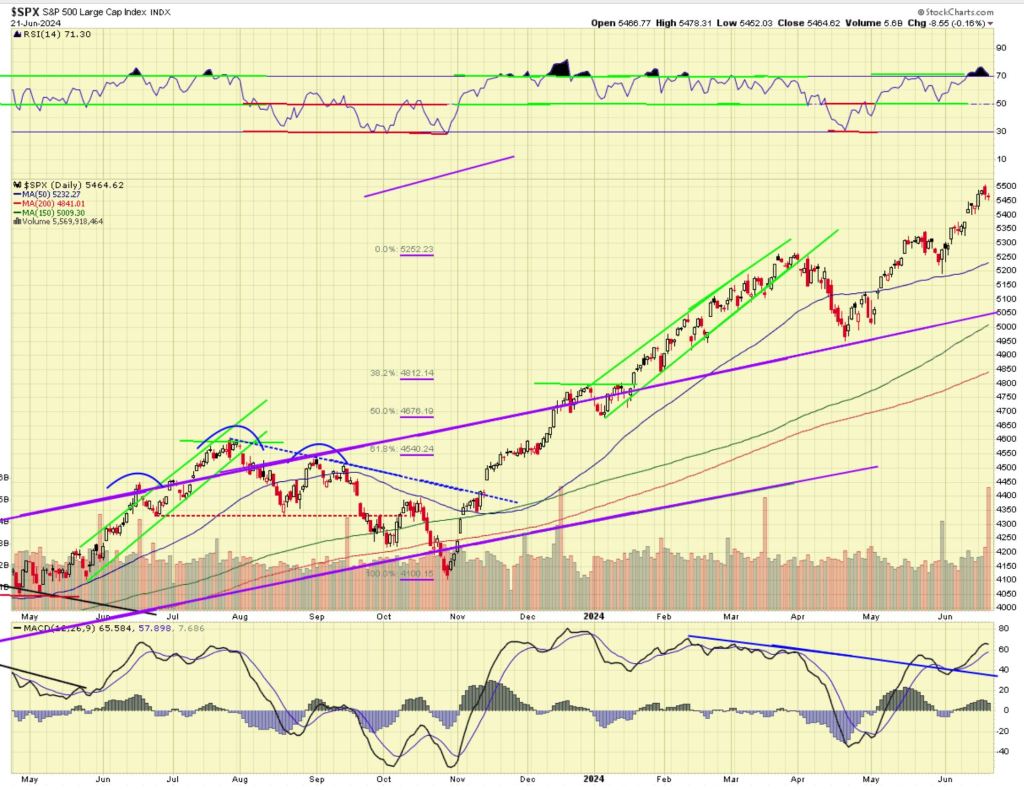
For the week ending 6/21/2024, the S&P 500 was up .5%.
Technically (see chart below) the market looks positive. RSI at the top of the chart is positive and overbought at 70, but it has slipped down a bit. Momentum shown by MACD at the bottom of the chart is positive, but it looks like it might turn to neutral. Momentum has weakened just a hair, and the histograms shrunk late in the week. The price action is positive, setting a new all-time high last week before declining Thursday and Friday.
We should expect some correction from overbought in the future. Nobody knows when or how big the correction will be. When a bull market gets overbought, it can get more overbought. Corporate buyback activity should have stopped now and earnings season will begin in force in 3 weeks. Companies have to wait 48 hours after their earnings report before they can begin buybacks again. Earnings and guidance will guide the market then.
What am I doing? A couple of weeks ago I bought a little of each of the MAG 7 stocks, except TSLA. I immediately put a 3% trailing stop loss under each because they were all at recent highs and with the market overbought there was real risk of a reversal, so I wanted to limit my loss if they did. Last week I mentioned I had bought NVDA and put the 3% trailing stop under it. This week I was stopped out of NVDA, with a 3% profit in 2 weeks. When I do something that I know is risky, like buying into a high flying stock that is at an all-time high, I buy a small position and use the protection of a trailing stop loss order. A trailing stop loss at 1% down is basically a sell order because most stocks have that much daily volatility. I tried 2% down and the result is the same as 1%, but maybe you get two or three days at most. I tried 3% down and this works for a close stop. When a high flyer will retreat 3%, it seems to be getting tired. It may turn around and rally after a 3% pullback, but I am willing to give those profits to others. You can use trailing stops on stocks and ETFs, and I use them on both. If a stock is oversold, I will go with a more generous trailing stop, like 10% or 8 % down. When I buy into an oversold stock, I plan to hold it longer and don’t want to be subject to daily swings, so I use a wider stop. Then I am trying to protect myself from a significant negative event that may take the stock down 20-30%. If that negative event occurs overnight and the stock opens down 20%, the trailing stop will immediately be converted to a market order and you will be sold out 20% down at the open. There is no protection from really bad news while the market is closed.
———————–
I would like to call your attention to a page of my blog called “CLASSICS”. It is located at the top of the blog, on the banner just under the title. The banner has links to “Home”, “About”, and now “Classics”. These are articles that I wrote one time for the blog, but they are valuable insights at all times for investors.
There are currently 3 Classic topics posted: 1) Is it a bull market or a bear market? 2) Why does healthcare cost so much? and 3) Implications of a large national debt. (posted August 2022)
You can use the hyperlink below the chart of the S&P that will open a larger picture of the chart in a separate window. If you bookmark the link to the chart you can look at it each day of the week to see how the market is progressing to certain milestones. The picture in this post is a static .jpg so it does not update.
I am a retired person and preserving capital and seeking income are important objectives for me. I also want a growth component to my portfolio, while minimizing major risk. My style of investing will not suit everyone. I like to sleep well at night. Investing involves risk, including the risk of loss.
I update each Saturday with my view of the stock market for the next few weeks (if occupied with family or travel, rarely I am a day or two late, just check back). The monthly “Long Term” update will be on the first Wednesday of each month, and this supports investors who want to buy and hold, but want to sell to avoid the bulk of a primary bear market, and buy back in for most of the next bull market.
If you lose your bookmark to the blog, google “Rich Investing Blog” and it should show up on the first page or so.
Economy:
The big deal of last week was the CPI on Wednesday, up 3.3% over last year, and down .1% from last month. The stock market liked it since three previous monthly reports had been higher than expected. Initial jobless claims for the prior week rose to 242K, well above the recent trend. I don’t start regularly reporting this unless it goes over 250K, but that was close. This is the kind of softness that might encourage the Fed into a rate cut. The PPI for May was -.2% which is a good sign for inflation to come down. None of these numbers was noteworthy, but they were all small moves in the direction of supporting a rate cut.
At the Fed meeting on Wednesday, the Fed left Fed Funds rate unchanged, again, up at 5.5%. Powell did indicate that with the data coming in, it was unlikely that the Fed would see the need for a hike of the interest rate and the market seemed to like that. The Fed has a report of where the various Fed governors see interest rates in the future, and the “dot plot” report showed the Fed reducing the number of rate cuts for 2024 from 3 down to 1. You would not think the stock market would like that, but when they look at the data, the traders seem to think if the data continues to come in cool, the Fed might put another rate cut on the table this year.
Earlier this month we saw the ECB cut their interest rate for the beginning of their interest rate cutting cycle. Central banks do not like to bounce around, with a cut then a hike. They like a uniform cycle so they withhold cuts until they are relatively certain that they can deliver a series of cuts. If this happens, one day I can remove “central bank restriction” from my monthly Long Term updates. In the long run, stock markets generally do well in a global interest rate loosening cycle.
Geo-Political:
Let’s talk about oil some more.
A major complication in the oil economy is matching the type of oil that is produced to the type of refinery required to refine the crude. NOT ALL OIL IS THE SAME! There are many kinds of oil, but the primary ones we hear about are light sweet crude and heavy sour crude. A refinery set up for one type cannot refine the other type, without an expensive modification. Here is a good article on the types of oil: https://kimray.com/training/types-crude-oil-heavy-vs-light-sweet-vs-sour-and-tan-count
You may hear people complain that with all of the US production capacity we should not be an importer of oil. That is simply an uninformed opinion. The article below does a good job explaining why this occurs:
——————————–
“Crude oil is not a homogenous product. The U.S. continues to import and export crude oil because the viscosity of oil (measured by its API gravity) being light or heavy and its sulfur content being low (sweet) or high (sour) largely determine the processes needed to refine it into fuel and other products. In general, refineries match their processing capabilities with types of crude oils from around the world that enable them to:
Make the most high-value motor fuels and other petroleum products in a cost-effective manner; and,
Serve niche product markets for chemicals, petrochemical feedstocks, lubricants, waxes and materials for roads and roofs.
While transportation runs primarily on motor fuels, our society also depends on thousands of products that begin as crude oil.
Heavier crude oils contain more complex molecules, so they are better for producing many of these niche products. However, turning heavy oil into high-quality products also requires more advanced molecular processing than is possible with simple refining or distillation.
Consequently, using heavy oil requires substantial capital investments in additional refining processes, such as cracking or coking, or so-called conversion capacity. With the requisite additional investment and processing cost, heavy oil typically has been priced less than light oil. In May, for example, Bloomberg data show that Western Canadian Select (WCS) heavy oil averaged $54 per barrel, while West Texas Intermediate (WTI) light crude oil averaged just above $70 per barrel.
The ability to process the heaviest crude oils has vastly expanded the Western Hemisphere’s oil resource and supply potential, as these oils come mainly from Canada and Venezuela. Therefore, many U.S. refiners are configured generally to process heavy crude oil.
Shifting purely to light crude oil could underserve some product markets and idle (or even strand) the hundreds of billions of dollars invested in refinery conversion capacity. The supply, demand and prices for various crude oils and products have continually solved this equation for producers and refiners to determine the role that crude oils of different qualities should play in the market, in accordance with economic fundamentals.
Since the U.S. energy renaissance has accelerated, however, most of the 4.8 mb/d of new U.S. oil production the past six years has been light oil. With U.S. refining capacity geared toward a diverse crude oil slate, a key implication for U.S. petroleum trade is that it would be uneconomic to run refineries solely on domestic light crude oil. Consequently, the United States:
Must import crude oil of different qualities to optimize production, given its mix of refining capacity; and,
Has more light crude oil than it can handle domestically, while this same quality of oil is in high demand in Asia Pacific and other regions that mainly have simple refineries (without conversion capacity).
Therefore, differences among crude oils are important reasons why the U.S. continues to import oil in an era of domestic abundance and export light oil that can be problematic, operationally and financially, to handle with existing U.S. refinery capacity (but also is of great value to refineries globally).”
The article dates back to 2018, but refining oil has not changed very much since then.
The US is and has been the largest producer of oil, every year for the last six years.
“March 11, 2024 (Reuters) – U.S. crude oil production lead global oil production for a sixth straight year, with a record breaking average production of 12.9 million barrels per day (bpd), the Energy Information Administration (EIA) said in a release on Monday.”
The bottom line remains that oil is a very complex marketplace, far more complex than most people realize. The US is doing fine in oil production, matching production to demand. This will be my last post about oil for a while. Next week I’ll look around the world at a large economy.
Technical Analysis:
For the week ending 6/14/2024, the S&P 500 was up about 1.8%.
Technically (see chart below) the market looks positive. RSI at the top of the chart is overbought at 71 and rising. Momentum shown by MACD at the bottom of the chart is positive. The price action is positive, setting a new record high in the past week. With the market overbought and at record high, the risk of a correction is there.
A few weeks ago I bought some RSP, the equal weight S&P. It has not gone anywhere, while the S&P has continued upward. That tells me that the Mag 7 continue to provide most of the gains and carry the market higher. I will continue to hold the RSP, with a 5% trailing stop loss under it.
What am I doing? I was active last week. I had a few shares of ADBE which jumped on good earnings and they said AI a few times, so I sold it. If it falls a little I will try to buy it back. With stocks moving up, I was able to buy back Put options that I sold several weeks ago with the market down at the time. I bought NVDA after the split and placed a 3% trailing stop loss under it and the trade is profitable on paper now (still have the stock).
———————–
I would like to call your attention to a page of my blog called “CLASSICS”. It is located at the top of the blog, on the banner just under the title. The banner has links to “Home”, “About”, and now “Classics”. These are articles that I wrote one time for the blog, but they are valuable insights at all times for investors.
There are currently 3 Classic topics posted: 1) Is it a bull market or a bear market? 2) Why does healthcare cost so much? and 3) Implications of a large national debt. (posted August 2022)
You can use the hyperlink below the chart of the S&P that will open a larger picture of the chart in a separate window. If you bookmark the link to the chart you can look at it each day of the week to see how the market is progressing to certain milestones. The picture in this post is a static .jpg so it does not update.
I am a retired person and preserving capital and seeking income are important objectives for me. I also want a growth component to my portfolio, while minimizing major risk. My style of investing will not suit everyone. I like to sleep well at night. Investing involves risk, including the risk of loss.
I update each Saturday with my view of the stock market for the next few weeks (if occupied with family or travel, rarely I am a day or two late, just check back). The monthly “Long Term” update will be on the first Wednesday of each month, and this supports investors who want to buy and hold, but want to sell to avoid the bulk of a primary bear market, and buy back in for most of the next bull market.
If you lose your bookmark to the blog, google “Rich Investing Blog” and it should show up on the first page or so.
The monthly Long Term post went up on Wednesday and follows this post on the website.
Economy:
The ISM manufacturing index for May was down to 48.7 from 49.2, while the ISM services index for May was up 4 to 53.8. Factory orders for April were up .7%. The US economy added 227K jobs in May, which is strong and interest rates rose modestly thinking the Fed would defer the first rate cut. The unemployment rate ticked up one tenth to 4.0%.
It still looks like a soft landing. This is exactly what the Fed wants. Powell said over a year ago that we would need a period of below trend growth in economic activity to bring inflation down, and that is what we have had so far this year. That is not what main street wants, but it is what the Fed has delivered. Main Street didn’t want 9% inflation either, and something has to give in order to bring inflation down.
Geo-Political:
Let’s talk about oil. My friends, strap in, because this will be long and not easy. If you think you understand the oil market, you are probably wrong. If you think it responds to the laws of supply and demand, you are partially, but not totally correct. The law of supply and demand works efficiently in a free market. But the OPEC cartel sits in the middle of the global oil market, and they make it a modified free market where some strange things can happen. To illustrate this, I will look at the crazy oil market, primarily in 2015, but things got even worse in 2016.
The first thing to understand is how tight global production MUST equal global consumption in order to keep prices stable. Look how tight the annual production and consumption track in the last 4 years. Producers have learned that they must not produce oil beyond the demand to consume, or prices will fall, to the detriment of all of the producers. The American conservative mantra of “drill baby drill” as a solution to high oil prices is such an over simplification of the issue as to be total BS. It indicates a fundamental misunderstanding of how the international oil market works. Look at the chart below and see how tight is the matching of supply and demand (Global liquid fuels production vs Global liquid fuels consumption). That has produced relatively stable oil prices in the $60 – $80 per barrel range, except for the Russian invasion of Ukraine and the dislocation of Russian oil exports that took a few months to sort out.
Now let’s look at what happened to oil prices in 2015, at the peak of the US oil renaissance brought about by the fracking revolution. The Bakken Shale in N. Dakota was a major new source of US production from 2010 to 2015, and it was shut down by the DROP in oil prices in 2015-2016, along with many smaller US oil companies that eventually went bankrupt, negatively impacting the banks that had loaned money to them.
Although the US was becoming an oil power from 2010 – 2015 because of our success with fracking, oil prices remained high in spite of the oversupply because Saudi Arabia and the rest of OPEC were cutting production to support the price. The Saudi’s could see that the rest of OPEC said they would cut production, but they did not, leaving all the production cutting to Saudi Arabia. Finally, Saudi Arabia said “Enough”! Saudi Arabia began to produce to their capacity and they flooded the market with crude oil. Crude fell from $100 a barrel to $50 in 2015, then to $30 in 2016. Saudi Arabia proved to the world they were the most important producer of oil, because they are the LOW COST PRODUCER and one of the very few who were profitable at $30 a barrel. The lessons to the world were 1) the Saudi’s still control much when it comes to oil, 2) it is better for everyone who can produce to accept a quota that keeps global production closely tied to global demand. If the US were to “drill baby drill” and produce as much as possible, they could produce a mismatch between supply and demand, and Saudi Arabia has the ability to punish such arrogant behavior. Saudi Arabia no longer has the ability to drive prices up for more than a few months until other producers can produce more, but they have the ability to drive prices down to a level where very few can make a profit, and that is a very powerful tool for them.
I’m going to copy in a long post that supports my assertions. It is so long that I won’t use the usual “quote” format, which will give it more room from left margin to right margin.
“May 21, 2015 – The global oil market is in upheaval. Prices plunged more than 50 percent between mid-2014 and mid-2015, leaving them hovering around $60 per barrel. Consumers, producers, and governments, all having grown accustomed to $100 oil, were taken by surprise. After all, just prior to their collapse, oil prices had held remarkably steady for three years, their most stable period since the end of the Bretton Woods era in the early 1970s.
What only a handful of observers saw coming was in effect a perfect storm: a sharp increase in supply driven by the production of unconventional oil from deep rock formations in the United States, coupled with sluggish demand in Asia’s emerging economic power centers, all intensified by financial speculation.
As a result, by the autumn of 2014, markets began to be flooded with oil and prices started to show weakness. At the November 27, 2014, meeting of the Organization of the Petroleum Exporting Countries (OPEC), which drew more attention than any of its gatherings since the global financial crisis of 2008, the cartel was widely expected to cut production in an effort to arrest the price decline.
And yet OPEC did no such thing. Instead, as it left production levels unchanged and prices fell further, observers were quick to declare that the cartel was over a barrel.
In fact, while the fate of individual member states may vary, OPEC as an institution—and Saudi Arabia, its leader—is likely to emerge from this paradigm shift stronger than before in many ways. With its new strategy—one born out of necessity—the kingdom is emphasizing market share, rather than price, while also moving to delegate the burden of balancing the world oil market to the U.S. shale industry. This, over time, will help the kingdom to meet rising domestic demand, and, at the same time, help OPEC lay claim to a bigger share of world oil markets that can be allocated—politics permitting—among resurgent producers such as Iran, Iraq, and Libya in the years ahead. Taken together, the moves mark a significant change in the geoeconomics of oil.
OPEC’s Long-Term View
To be sure, $60 oil hurts OPEC member states. Venezuela would like to see prices shoot beyond the $100 per barrel mark again and lift state budgets out of the red, as would Kuwait and Iran. But looking at the short-term fiscal interests of OPEC members misses the point. OPEC has a long-term view, and it has learned from history—more precisely from the aftermath of the oil price surge of the 1970s.
Embargoes and high prices in the early 1970s brought new producers to the stage, notably Mexico, Norway, the United Kingdom, the U.S. state of Alaska, and the Soviet Union, rapidly expanding global supply by the end of the decade. In response, OPEC started cutting production, which led to a significant loss of market share but did little to stabilize prices, as non-OPEC producers kept on pumping even more. It was Saudi Arabia, the swing producer, that absorbed these losses, while most fellow OPEC countries were free riders.
Saudi Arabia’s oil output contracted to 2.4 million barrels per day (mbd) in August 1985, down from more than 10 mbd in 1980. In 1986, when the kingdom eventually opened the floodgates and ramped up production to 5 mbd, prices immediately collapsed, falling 50 percent from 1985 to 1986.
This undoubtedly hurt OPEC economies. In Saudi Arabia, which had cut production from 1982 onward, the state budget was already in deficit when the price collapsed.
Yet the long-term effect of the low price was a declining market share for non-OPEC producers in the United States and Northern Europe, whose higher production costs were no longer sustainable in the new price environment. OPEC learned an important lesson: accept the immediate pain and come out stronger in the long run.
Today, Saudi Arabia’s economy is far better prepared for a sustained period of low oil prices than ever before. In the mid-1980s, the ratio of Saudi Arabia’s gross domestic savings to gross domestic product (GDP) was about 10 percent; by contrast, 2013 figures from the World Bank suggest a savings rate of 44 percent. The country has one of the lowest debt-to-GDP ratios in the world, even as social spending has accelerated in the wake of King Salman’s ascension to the throne in January 2015, draining foreign reserves by $36 billion, or 5 percent, in only two months.
As Riyadh imposes its will on OPEC, it is prepared to accept short-term budgetary pressures in order to salvage market share in the most important commodities market in the world. That its rivals Russia and Iran are also losing out due to the low price is simply icing on the cake.
High-Cost Competitors Feel the Pain
Low oil prices hurt producers that need prices consistently above $60 a barrel in order to be profitable. That means the biggest loser in the current market is not OPEC, but high-cost producers such as Brazilian offshore ventures, Canadian oil sands, many Russian greenfield projects, which require the construction of new facilities, and, in specific areas, the U.S. shale industry.
Already, prices below the $50 mark have put international oil majors into rationalization mode. BP announced a $1 billion restructuring program in late 2014 that called for thousands of jobs to be eliminated by the end of 2015. ConocoPhilips followed suit, while Schlumberger, the world’s largest oil services company, said in 2015 that it would lay off 15 percent of its workforce. Oil stocks saw a bloodbath, and, in mid-2015, U.S. rig counts were at their lowest levels since mid-2010.
Canadian oil sands in the province of Alberta have high up-front costs but far lower operational costs than conventional oil, meaning that projects that are already on line or under construction will continue apace, but a broad swath of future investments will be scrapped if low prices persist—casting doubt on the prospects of a resource base that was at one point expected to shoulder the lion’s share of future non-OPEC supply growth.
The up-front investment required to extract shale oil is comparatively low, making it easier to halt production when spot and short-term futures prices are low, and to begin drilling again when prices pick up.
In the near term, many of the small and midsize players that dominate North America’s shale sector will not survive. They lack the deep pockets and diversified risk portfolio of the oil majors and their state-owned OPEC counterparts and will increasingly be forced to consolidate and restructure.
The impacts are already being felt across the U.S. states of Texas and North Dakota. Many companies that are active in shale oil have been spending more than they are taking in, and they have relied on optimistic price and productivity assumptions to fund their growth. Their debt has overwhelmingly been downgraded to junk status; their revolving credit facilities, linked to the price of oil, are shrinking; and capital is increasingly scarce.”
If anyone thinks that “drill baby drill” will work to lower oil prices in the US for more than a year, read the article above again until you understand why it will not. The new sources of oil in the US require a certain oil price to remain profitable, and Saudi Arabia can drive the price below their cost of production, bankrupting them. Saudi Arabia has and will again accept the short term pain for their long term objective, which is protecting their market share. They have demonstrated what the rules are. They don’t have this power because they produce the most oil, the US has surpassed Saudi Arabia in oil production for several years. Saudi Arabia has the power because they are the low cost producer. They can survive a price war better than anyone else, so they have the power. I think all the other producers see that, and it is no use to poke a tiger. It is not a good idea to raise production above the level of demand; they must stay in close synchronization.
If you look at the report in the link below there is a graph showing that in 2015 there were 38 oil company bankruptcies in the US, followed by 70 in 2016. Again, if you think “drill baby drill” is a viable US energy policy, you did not understand what was going on in 2015-2016. Those conditions have not changed; Saudi Arabia is still one of the lowest cost producers of oil. Those who don’t know history are doomed to repeat it.
Some conservatives have blamed the banks for being woke or pushing an environmental agenda for the harsh seeming conditions they place on oil companies looking for loans in order to drill. That is a lie. Bankers care about making a profit most of all. The bankers have long memories, they look at the 108 oil company bankruptcies in 2015-2016, and they are cautious. The oil companies are sometimes overly optimistic, and if the banker really wants to get his money back, he has to look at the proposed project with a more rational eye. He may require the oil company to put more of its capital into the project and borrow less, and he may charge a higher interest rate because of the risk the bank is taking. Oil prices are volatile. It’s not about being woke, it’s about doing sound business.
I have thought about writing something like this for a while, and I did not because I knew it would be hard to do in the space that I normally take, hard to do period, and it would take quite a bit of research. I finally took the bit (that’s an old expression that refers to horses, for my young readers), and yes, it’s long. I put in a special effort, so I hope you got something out of it, if you made it to this point!
Technical Analysis:
For the week ending 6/7/2024, the S&P 500 was up about 1.5%.
Technically (see chart below) the market looks positive. RSI at the top of the chart is high neutral at 67. Momentum shown by MACD at the bottom of the chart is neutral. The price action is positive, but the last three closes are flat.
There won’t be much big news in the near term since earnings are mostly over, and corporate buybacks will stop in mid-June. Apple has their big developer day on Monday and that could boost AAPL, which would boost the stock indices a little. But the general lack of earnings news and the halt of buybacks until after earnings represent risks, along with elevated PE valuation of the market in general.
What am I doing? The market is nearly overbought again and while rising, it does not show much energy. I sold some of the good stocks I bought on the recent downturn. I kept my PLTR and sold covered calls on it, the call premium was nice for a low priced stock. I sold CRWD after it popped up, then it popped up higher since it will be added to the S&P 500 on Monday. Every time you buy and S&P index fund, the fund will have to buy more CRWD as well as all the stocks in the index. The move to passive investing through index ETF’s is concentrating gains in those stocks in the index, whether the company is doing well or not. They get bought by the index funds.
———————–
I would like to call your attention to a page of my blog called “CLASSICS”. It is located at the top of the blog, on the banner just under the title. The banner has links to “Home”, “About”, and now “Classics”. These are articles that I wrote one time for the blog, but they are valuable insights at all times for investors. I will announce in the weekly blog when I add a new classic.
There are currently 3 Classic topics posted: 1) Is it a bull market or a bear market? 2) Why does healthcare cost so much? and 3) Implications of a large national debt. (posted August 2022)
You can use the hyperlink below the chart of the S&P that will open a larger picture of the chart in a separate window. If you bookmark the link to the chart you can look at it each day of the week to see how the market is progressing to certain milestones. The picture in this post is a static .jpg so it does not update.
I am a retired person and preserving capital and seeking income are important objectives for me. I also want a growth component to my portfolio, while minimizing major risk. My style of investing will not suit everyone. I like to sleep well at night. Investing involves risk, including the risk of loss.
Once a month, on the first Wednesday of the month, I will put up a long term view of the market. This is provided for investors who don’t want to trade secondary swings in the market, but would like to exit the stock market relatively soon after a bear market begins, or enter the market after a new bull market begins (change in the primary trend). In the blog, they will always have a title called “Long Term (month) (year)”, so you can use your browser “Find” function and easily find them.
I made some format changes to section headings. When I used to cut and paste from Word into WordPress.com, I lost some of the old formatting and had to go fix it every time. I hope this is less busy work for me and more readable for you.
Economics
–GDP:
The second estimate of 2024 Q1 GDP is +1.3%, following Q4’s +3.4%.
The Atlanta Fed GDPNow estimate for Q2GDP as of June 3 is +1.8%, down from 2.7% a month ago.
This is neutral for the stock market, just below the long term trend of +2%.
Year
Quarter
GDP %
2024
Q1
1.3
2023
Q4
3.4
2023
Q3
4.9
2023
Q2
2.1
2023
Q1
2.0
2022
Year
1.0
2021
Year
5.5
2020 – Covid
Year
0.1
2019
Year
2.3
2018
Year
2.9
2017
Year
2.6
2016
Year
2.0
–Fed Interest Rates:
The Fed has left the Fed Funds rate unchanged at 5.5% for months. The next Fed meeting is June 11-12.
Interest rates ticked down a bit in late May, about .2% across longer duration bonds. The unemployment rate has ticked up a bit, GDP remains sluggish, so sort of a “soft landing” right now.
The bond market is split between one or two rate cuts, beginning in either July of Sept.
At the last Fed meeting, they announced they will scale back Quantitative Tightening from $90 billion per month to $60 billion per month. When the Fed allows bonds to roll off their balance sheet, the private sector has to buy them, which takes money out of circulation. This has been good policy to reduce inflation. But we don’t want to slow the economy so much that we slip into recession. This looks like a good first step to stop taking so much money out of circulation.
Local and regional banks have tightened lending standards making it harder for small and medium businesses to get loans to expand. That will slow the economy down somewhat.
The latest CPI was +3.4% versus a year ago. Interestingly oil has fallen a bit lately.
Fed policy is restrictive for the economy, and bearish for the stock market. But we are probably at the peak of interest rates, we have been on pause, and the next move appears to be down.
Date
Fed Funds Rate
5 Year Treasury
10 Year Treasury
30 Year Treasury
Jun 2024
5.5
4.4
4.4
4.5
May 2024
5.5
4.7
4.7
4.8
Apr 2024
5.5
4.7
4.7
4.8
Mar 2024
5.5
4.2
4.2
4.4
Feb 2024
5.5
4.3
4.3
4.4
Jan 2024
5.5
4.0
4.1
4.4
2023 Q4
5.5
4.4
4.4
4.5
2023 Q3
5.5
4.4
4.3
4.4
2023 Q2
5.1
3.8
3.6
3.9
2023 Q1
4.7
3.8
3.6
3.8
2022 Year
2.8
3.1
3.1
3.2
2021 Year
0.2
0.8
1.4
2.0
2020 Year
0.4
0.6
0.9
1.6 – Covid
2019 Year
2.2
1.9
2.2
2.6
2018 Year
1.8
2.8
2.9
3.1 – Tax Cut
2017 Year
1.0
1.9
2.3
2.9
Valuation
–S&P 500 Earnings:
Factset shows that as of May 31, for Q1 of 2024,the blended year-over-year earnings increase for the S&P 500 is +5.9% (the blend is 98% actual earnings and 2% estimated). That is the best year over year quarterly growth in profits in two years! As recently as April, the Factset estimate of Q1 earnings was only .5%. Last December they estimated that Q1 earnings would be up 6.2% vs. last year. It appears to me they are not very good at estimating, yet on CNBC, Factset is frequently cited as the source of earnings estimates.
The forward PE for the S&P is 20.3, up from 19.9 last month when stocks were going down. That compares to the ten year average of 17.8, but remember, the forward PE is just a guess.
The 12 month forward “operating earnings” estimate on the S&P 500 from the Standard and Poor’s company is $250, unchanged from last month.
I have been thinking about how Factset keeps changing the earnings estimates through the year. This is a number the pros look at, but most of us amateurs do not. The question is, if earnings estimates keep coming down, do stock prices eventually come down? They should, or the PE ratio will continue to climb, making stocks expensive on a PE basis. I’m not going to keep much history, only about 12 months of data. The number that Factset should have the most confidence in is the current quarter, Q1, and it has almost been cut in half from Dec. Tracking this should be fun, at least I think so. Old Rich attempts a new trick.
MONTH
Q1 Estimate
Q2 Estimate
Q3 Estimate
Q4 Estimate
CY Estimate
Jun
5.9% actual
9.2%
8.3%
17.5%
11.3%
Apr
0.5%
9.6%
8.7%
17.7%
10.7%
Mar
3.4%
9.3%
8.4%
17.4%
10.9%
Feb
3.9%
9.0%
8.0%
17.6%
10.9%
Jan
5.4%
10.0%
8.2%
22.1%
12.0%
Dec
6.2%
8.5%
10.7%
18.1%
11.5%
Chart – S&P 500 Earnings Estimates, by Month
Telling the future is hard. Why do I even bother to report future estimates of earnings? Earnings (profits) drive the stock market. I look to the pro’s for their estimates, then I take them with a grain of salt. Even if the estimates turn out to be wrong, that is the data that the stock market is trading on today. It’s the best we have, and it may be wrong by a little, or sometimes a lot.
The outlook for earnings is bullish at +5.9% for Q1.
–P/E on the S&P 500:
The current 12-month trailing GAAP PE on the S&P 500 is 27.5, up from 26.1 last month. I used 4 quarters of earnings with the most recent being Q1 2024. The S&P rose rapidly over the last month, so the valuation rose.
I recalculated the 30 year trimmed P/E of the S&P 500, which I had not done since I started the blog 8 years ago. The PE rose from 19 to 21 so I will change the terminology of the numerical bands below. The neutral range will expand, centered at 21 instead of 19. The PE rise can be a function of the nature of Information Technology (IT) companies, which are less capital intensive than older smokestack companies. It could also be a function of changing investor sentiment. But, it HAS CHANGED.
This metric is significantly overvalued relative to my trimmed 30 year average of 21. I trimmed out the quarters during recessions for my 30 year average, since the P/E behaves very abnormally during those times. My terminology will be 19 – 22 as neutral, 23 – 26 would be moderately overvalued (neutral), while 27 – 30 would be significantly overvalued (bearish). Above 30 would be dangerously overvalued (bearish). On the downside, I will go with 14-18 being moderately undervalued (bullish) and 9-13 being significantly undervalued (bullish). As a last resort, I will go with 4-8 as being egregiously undervalued (bullish), and hope we never see that because all investors will be in pain at that point. Admittedly these are somewhat arbitrary, but I have been watching this metric since 1995.
This indicator is bearish, but just barely so.
Age of the Primary Move, Bull or Bear Market:
This bull market is 20 months old, started in Oct. 2022. The age is neither bullish nor bearish, but it is worthwhile to keep it in mind.
Geo-Political
–Presidential Election: (added March 2024) – On Nov. 5th we will elect a new president. Joe Biden and Donald Trump are the two primary candidates, and Robert Kennedy Jr. is the main third party candidate. Kennedy cannot win, but he may prevent one of the other two from winning. It depends who he takes more votes away from, and right now we don’t know. Based on forward looking policies, and who the projected winner is, the stock market will start to favor better positioned companies, based on the assumed victorious candidate’s policy priorities. It’s too early to tell, but keep your eyes peeled.
–Liquidity: Central banks globally raised rates to fight inflation, but most are pausing their interest rates. Inflation appears to be coming under control, but it is not where the central banks want it. They appear to be on pause to see if the hikes already in place will slow inflation to the target without additional hikes. The ECB is RUMORED to deliver its first RATE CUT on 6/6, its first since 2019.
–US / China: It appears that the US and China are engaged in a tug of war to see who is the world’s economic leader. China has advantages in low cost labor and some natural resources such as rare earth metals, but they lack oil and natural gas. China developed the ability to produce advanced electronics with the aid of the US, but the primary market for those items is the US and Europe. The US has long been a technology leader and we have sophisticated financial markets that are usually well regulated. Another major factor is global alliances. The US has strong alliances with NATO, Canada, Japan, and S. Korea, while China has a strong relationship with Russia and Iran.
The economy in China is slowing more than their government would like. Trade tension with the US contributes to the distress since US corporations are expanding outside of China, notably in Vietnam and India. The Chinese govt. has been hostile to free market activity by their own corporations such as Alibaba and Ten Cent. Their real estate sector was over leveraged and is in trouble.
–Ukraine: Thewar in Ukraine drags on. Ukraine is having more success on the battlefield than most expected, with the help of western weapons. Russia is destroying much of eastern Ukraine’s cities and rebuilding will be difficult. Sanctions against Russia are disrupting commodity markets since Russia was such a large exporter or oil, natural gas, and metals. Ukraine was a large exporter of wheat and other foods and that export is hindered by the war. It appears that after the initial shock in the commodity markets when Russia invaded, prices have stabilized and the world is dealing with new sources and trading patterns.
–Middle East Conflict: Hamas launched a violent attack on Israel on Oct. 7, 2023 using missiles and ground forces and Israel has responded with bombings inside Gaza. It’s a mess, but impact to the US economy is not noticeable. The Houthi rebels in Yemen are firing missiles at shipping in the Red Sea, causing many ships to go around Africa to Europe instead of using the shorter Suez Canal. That will increase wait times and raise transportation costs.
–US National Debt: (added Sept. 2023) The US national debt is very large at over $34 trillion and it is growing too rapidly. I have been concerned about it since early in this century. If there is too much new debt and investors don’t want to buy the bonds that the US issues to fund the deficit, they may have to keep the interest rates high, particularly longer term interest rates, high enough to attract bond investors. Companies will then have to pay higher rates to fund long term projects and that will cut into their profits. Consumers facing high interest rates will slow purchases. It is not a good situation for the economy.
Geo-politics is currently bearish, mainly due to the wars in Ukraine, global central banks restrictive policy, and the Israeli conflict with Hamas.
Technical
Technically the chart below is bullish near term (months), and still positive longer term (year). It is important to note this is on a “long term” basis, and is not the same verdict as you would see on the weekly report which is a 12 month basis instead of this 10 year view.
RSI at the top of the chart is neutral at 69 and rising, a change from last month. Momentum shown by MACD at the bottom of the chart is positive and rising. The price action is positive near term and positive longer term.
This close to the top of the up-channel, there is the risk of a correction. We can also go higher, above the top of the channel, like we did in 2021, but that was driven by excessive stimulus from the Covid cash infusion cycle from the govt. I don’t see that type of stimulus now, in fact the Fed interest rates are restrictive. What seems to be giving the market this boost is the computing revolution called Artificial Intelligence (AI).
Ten Year Chart of the S&P 500
This is bullish in the short run, and remains bullish longer term.
Conclusion
GDP growth is neutral with Q1 GDP rising by 1.3%.
The Fed has short term rates at 5.5%. That is restrictive and bearish.
S&P earnings for Q1 are estimated to be +5.9% above Q1 2023 which is bullish.
The PE valuation of the S&P based on the 12 month trailing GAAP number is 27.5, which is significantly overvalued and bearish.
The geo-political factors are bearish.
Technically the chart looks bullish short term, and bullish longer term.
By that way of looking at it, the market is bearish, but less bearish than last month. There are three factors bearish (Fed, PE Valuation, and geo-politics), two bullish (S&P Earnings, Technicals), and one neutral (GDP). Remember, this is a long term view.
Long Term Issues to Keep in Mind:
National Debt:
(January 2024) – The national debt is over $34 trillion.
(Late 2020) – The total national debt exceeds $26 Trillion, and as interest rates rise, the component of the annual budget allocated to “interest on the debt” will increase, putting pressure on existing programs, or increasing the deficit. If the deficit is allowed to rise too much in good economic times, the value of the dollar will fall and that is inflationary which is usually bad. The thing saving us today is how poorly all the other nations are managing their economies, so the dollar continues to hold up.
(Updated March 2020) – Covid 19 begins. Well this is going to get a lot worse. Looks like the politicians are going to be printing money and dropping it from helicopters. But all the other major economies will do the same thing, so relatively, the dollar may not drop much (which would be bad for inflation).
(Negative – Noted Jan. 2018) The deficit will go up despite the republicans saying that if the tax cut bill is “dynamically scored” using “possible” increases in economic activity, it will hold down the deficit by increasing tax receipts. This has not been shown to work in the past. The US added $980 billion to the national debt in fiscal 2019 (ended 9/30/2019), a tragedy in good financial times.
I update each Saturday with my view of the stock market for the next few weeks (if occupied with family or travel, rarely I am a day or two late, just check back). The monthly “Long Term” update will be on the first Wednesday of each month, and this supports investors who want to buy and hold, but want to sell to avoid the bulk of a primary bear market, and buy back in for most of the next bull market.
If you lose your bookmark to the blog, google “Rich Investing Blog” and it should show up on the first page or so.
The monthly Long Term update will be posted Wed. June 5th.
Economy:
The Case Schiller home price index (20 cities) for March was +7.4% over the last year, which is too high. Consumer confidence from the Conference Board jumped from 97 to 102 in May, which is good. I am switching to the Conference Board from U. of Michigan for this measure since hearing a discussion on CNBC that the Conference Board was more rigorous in collecting their data. The first revision of Q1 GDP was +1.3%, a little lighter than first reported, which would aid the “rate cut” camp. Consumer spending for April was up .2%, not hot, but we don’t want “hot” right now. Core PCE Y-o-Y (the Fed’s favorite number on inflation) was +2.8%, which is low enough to support a Fed rate cut.
It looks like a soft landing, except home price inflation is still too high, and home prices are important.
Geo-Political:
Trouble in the US Treasury bond market last week, and that will put pressure on stocks.
“May 29, 2024 – Yields on U.S. government debt finished at their highest levels in about a month on Wednesday after another Treasury auction was met with poor demand and as concerns grow that the Federal Reserve may have to keep interest rates higher for longer.
What happened?
The yield on the 2-year Treasury BX:TMUBMUSD02Y rose 3.2 basis points to finish at 4.983% after factoring in new-issue levels. The yield on the 10-year Treasury BX:TMUBMUSD10Y rose 8.1 basis points to 4.623%, from 4.542% on Tuesday.The yield on the 30-year Treasury BX:TMUBMUSD30Y jumped 8.6 basis points to 4.742%, from 4.656% on Tuesday. Wednesday’s levels for the 2-, 10- and 30-year rates are the highest since April 30, based on 3 p.m. Eastern time figures from Dow Jones Market Data.
What drove markets?
Treasury’s $44 billion sale of 7-year notes on Wednesday tailed by 1.3 basis points in a sign of weak demand. Indirect and direct bidders took below-average shares of the sale, which forced primary dealers to step in by more than usual.It was the third auction this week to raise questions about the market’s appetite for Treasury supply. Tuesday’s sales of 2-year and 5-year notes, which totaled almost $140 billion, were also not very well received, contributing to a selloff on the same day that sent 10- and 30-year yields to their highest closing levels since May 2-3.Separately on Wednesday, the Fed’s Beige Book report showed that economic activity continued to expand from early April through mid-May, although conditions varied across industries and districts. Retail spending was flat to up slightly.”
This is the flip side of the comments last week about China reducing its holdings of US Treasury bonds. A big buyer pulls out and others have to step up to buy the bonds. If not enough people step up, the price of the bond will be reduced which will increase the yield of the bond in order to make it more attractive to investors. That in turn makes borrowing more expensive for business since Treasury yields influence commercial rates and that puts a drag on the economy. If inflation remains high, bond investors demand a higher interest rate that will exceed the inflation rate, so they get a positive “real return” (the nominal interest rate of the bond, minus the inflation rate). The deficit comes into play here because if investors don’t believe the government is a sound financial steward, they will expect higher inflation and demand higher interest payments on money they lend to the government. One day, the rock will meet a hard place.
Another factor in who will buy Treasury bonds here at home is whether you think you have enough bonds already. I did not hold any bonds or CD’s for over a decade when interest rates were so low after the GFC. In the last year, I increased my CD holdings to 10-20% of my portfolio, but that is all that I want. If everyone gets all the bonds they want, how are they going to get you to buy more? Only a very high risk free yield would tempt me to buy more, and it happened in the early ‘80’s, so it might happen again.
Technical Analysis:
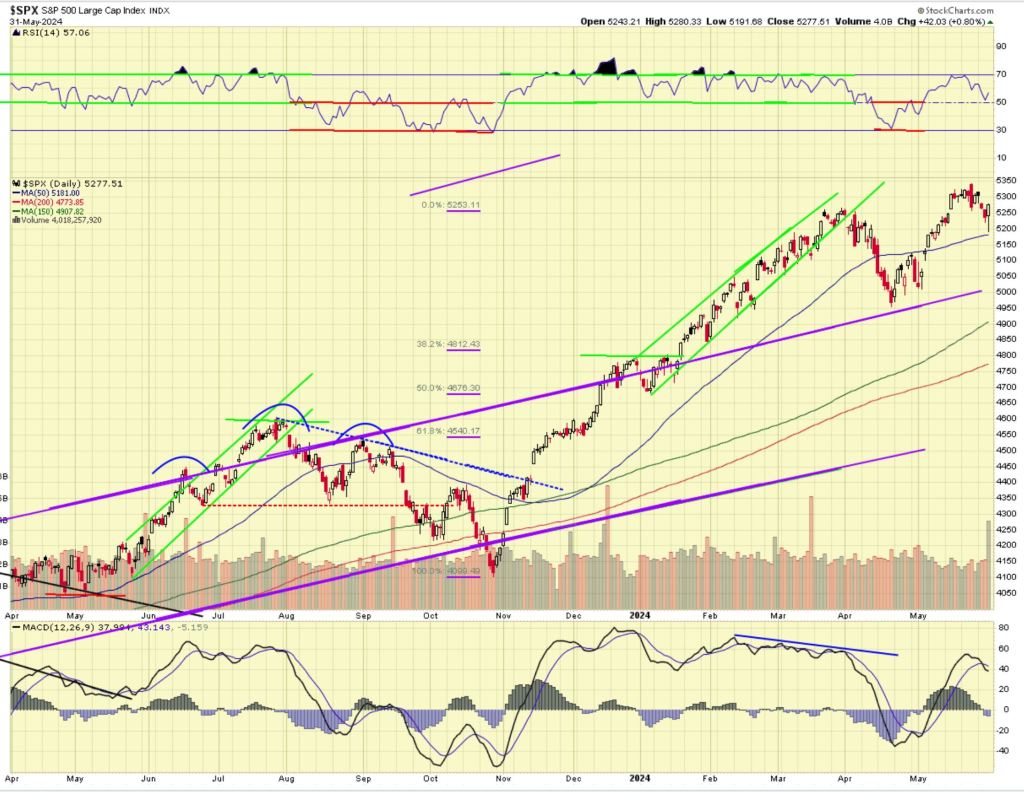
For the week ending 5/31/2024, the S&P 500 was basically flat.
Technically (see chart below) the market looks negative near-term. RSI at the top of the chart is neutral at 57 but falling. Momentum shown by MACD at the bottom of the chart did roll over and is near-term negative. The price action is negative near-term and positive longer term.
I said last week that after the sustained uptrend from the Oct. low, I did not think it had been corrected enough by the 5% pullback in May. We’ll have to see where this little correction goes from here. The last two weeks of each quarter see diminished activity from corporate buybacks. From Raymond James:
“Most publicly traded companies have a policy that restricts trading in company shares (a “blackout policy”) beginning two weeks prior to the quarter end through 48 hours after earnings are released publicly.”
What am I doing? I started to buy a little, IBM, a quality mature technology company. I sold a META Jul 420 Put, the PE on META is 27 and I would be OK if assigned at 420. I added a little CRM on its pullback, as well as SNOW. If the pullback continues, I plan to buy more. I view this as a correction in a bull market.
———————–
I would like to call your attention to a page of my blog called “CLASSICS”. It is located at the top of the blog, on the banner just under the title. The banner has links to “Home”, “About”, and now “Classics”. These are articles that I wrote one time for the blog, but they are valuable insights at all times for investors. I will announce in the weekly blog when I add a new classic.
There are currently 3 Classic topics posted:
Is it a bull market or a bear market?
Why does healthcare cost so much?
Implications of a large national debt. (posted August 2022)
You can use the hyperlink below the chart of the S&P that will open a larger picture of the chart in a separate window. If you bookmark the link to the chart you can look at it each day of the week to see how the market is progressing to certain milestones. The picture in this post is a static .jpg so it does not update.
I am a retired person and preserving capital and seeking income are important objectives for me. I also want a growth component to my portfolio, while minimizing major risk. My style of investing will not suit everyone. I like to sleep well at night. Investing involves risk, including the risk of loss.
I update each Saturday with my view of the stock market for the next few weeks (if occupied with family or travel, rarely I am a day or two late, just check back). The monthly “Long Term” update will be on the first Wednesday of each month, and this supports investors who want to buy and hold, but want to sell to avoid the bulk of a primary bear market, and buy back in for most of the next bull market.
If you lose your bookmark to the blog, google “Rich Investing Blog” and it should show up on the first page or so.
Economy:
Existing home sales for April inched down to 4.1 million units annualized, from 4.2, while new home sales also inched down to 634K units annualized from 665K. That is not good news as we are in the spring season which is usually strong. High interest rates and high home prices are not a good combination for buyers. The real estate sector is important to the US economy and this is part of the slow down. We see the stock of Home Depot is weak. It all hangs together. On the other hand, this is exactly what the Fed wants to see when they go on an extended period of rate hikes like over the past two years. This slowdown is how you bring inflation down.
Durable goods orders for April were up .7%, that’s good.
This looks like a soft landing to me, so far.
Geo-Political:
I report a lot about China, but they are our top trading partner, about equal with all of the EU trade we do. With the US in a trade war with China, developments with them loom larger.
“04/21/2024 – As the Chinese accumulate more and more gold, they’re dumping U.S. Treasuries.
That raises an important question: who is going to keep funding the federal government’s borrowing spree?
China offloaded another $22.7 billion in U.S. Treasuries in February, according to the latest data from the Federal Reserve. That dropped its total holdings to $775 billion.
China still ranks as the second-largest foreign holder of U.S. debt, but the U.K. could soon overtake China and slide into the second position if the current trend continues.
Japan ranks as the biggest foreign U.S. creditor with $1.17 trillion in Treasuries. The U.K. comes in third with $700.8 billion in U.S. Treasuries.
China has been divesting itself of U.S. debt for several years. The country’s Treasury holdings have fallen to their current level from around $1.1 trillion in 2021. Chinese investment in U.S. debt hit a 14-year low in October.
Renmin University finance professor Zhao Xijun told the South China Morning Post that the selloff will likely continue.
“China’s overseas investment has been concentrated on U.S. Treasuries in the past, [but] there is space for the Chinese government to further cut back its holdings in the future.
China is intentionally minimizing its exposure to the dollar. Chinese policymakers have seen how the U.S. uses the dollar as a foreign policy weapon. Last month, Janet Yellen floated the idea of seizing Russia’s frozen dollar-denominated assets and giving them to Ukraine.
The Chinese aren’t dumb. They realize the U.S. could put the same kind of squeeze on them. So, if you recognize something makes you vulnerable, what do you do?
You minimize the vulnerability.
In other words, if you are concerned that the U.S. could pull the “dollar rug” out from under you, why not pull out from the dollar system first?
This seems to be China’s strategy.
Meanwhile, the Chinese are stockpiling gold, a reserve asset that carries no counterparty risk at all.
The People’s Bank of China has added gold to its reserves for 16 straight months, adding over 300 tons of gold to its stash since it resumed reporting gold purchases in October 2022.”
Going all the way back to Ronald Reagan who opened trade with China, the plan was to improve their economy and HOPE that they would buy in to western standards of international business, and that would lead to democratic political reforms. China welcomed the development of their economy, and at times appeared to enact capitalistic economic reforms, but less than the US hoped for. For US companies to do business in China, they had to have a Chinese partner. It was not a free market. Xi Jinping has backed off of previous reforms, clamping down on some of their most important companies like Alibaba, and silencing its CEO, Jack Ma. China has been building up its military for decades and threatens Taiwan and shipping in the South China Sea. President Trump began the trade war with China, and he seemed to expect to win concessions from China quickly, which has not happened. President Biden has continued the trade sanctions and ramped them up higher, denying China access to the most powerful computer chips, which could find their way into military weapon systems. So, here we are. China retaliates economically. If a large buyer of US debt pulls out of the market, others must buy the debt. If they feel US fiscal policy is irresponsible (i.e. the annual deficit is too high), they will demand a higher interest rate to compensate them for the higher currency risk of the US dollar falling in value. The Fed cannot control that. That could pose a big risk to the US economy if bond buyers push up yields on US debt, as that will reduce funds available for investment in the economy by businesses if they have to pay more for loans.
Technical Analysis:
For the week ending 5/24/2024, the S&P 500 was unchanged.
Technically (see chart below) the market looks fair. RSI at the top of the chart is neutral at 63, but dropping. Momentum shown by MACD at the bottom of the chart is neutral, moving sideways, but the histograms are shrinking and it is in danger of rolling over. The price action is neutral.
We had a powerful rise in the market from the Oct. low to the March high, followed by a 5% correction in April. We rallied back in May to a new high. I still wonder if we might need more corrective action to the downside?
What am I doing? I was selling into strength last week. I sold CRWD and MRNA because they had run up too far too fast and they are overbought. MRNA is up on a POSSIBLE bird flu problem this summer and a new Covid strain but nobody knows how much it will spread. MRNA is also working on a cancer therapy, but it is over a year off. I sold some SPY. All of those could continue higher but the chart indicates most of the rise has occurred for the near term.
———————–
If you enjoy these updates, please tell your friends and family who are interested in the stock market about this blog.
I would like to call your attention to a page of my blog called “CLASSICS”. It is located at the top of the blog, on the banner just under the title. The banner has links to “Home”, “About”, and now “Classics”. These are articles that I wrote one time for the blog, but they are valuable insights at all times for investors. I will announce in the weekly blog when I add a new classic.
There are currently 3 Classic topics posted:
Is it a bull market or a bear market?
Why does healthcare cost so much?
Implications of a large national debt. (posted August 2022)
Your comments and questions are always appreciated, so feel free to comment using the “Leave a Comment” feature just under the title of the post.
You can use the hyperlink below the chart of the S&P that will open a larger picture of the chart in a separate window. If you bookmark the link to the chart you can look at it each day of the week to see how the market is progressing to certain milestones. The picture in this post is a static .jpg so it does not update.
I am a retired person and preserving capital and seeking income are important objectives for me. I also want a growth component to my portfolio, while minimizing major risk. My style of investing will not suit everyone. I like to sleep well at night. Investing involves risk, including the risk of loss.
I update each Saturday with my view of the stock market for the next few weeks (if occupied with family or travel, rarely I am a day or two late, just check back). The monthly “Long Term” update will be on the first Wednesday of each month, and this supports investors who want to buy and hold, but want to sell to avoid the bulk of a primary bear market, and buy back in for most of the next bull market.
If you lose your bookmark to the blog, google “Rich Investing Blog” and it should show up on the first page or so.
I was without electricity for 22 hours from Thur. night to Friday afternoon. We had 20 minutes of the most intense weather I have experience in Houston in the 37 years that I have lived here. I was fortunate we only had small limbs down, but there were a lot of them. Downtown Houston had many windows knocked out of the high rise buildings.
Economy:
The CPI Y-o-Y was +3.4%, down from 3.5% last month. That doesn’t do anything for me, we’re still stuck at 3%. Retail sales in April were flat. The Leading Economic Indicators in April were -.6, another in the long line of negative LEI. This long line of negative LEI reports usually precedes a recession, and yet no recession has occurred yet..
The economy looks like the desired “soft landing” where business slows enough to bring down inflation, without causing a recession. We have to wait to find out the end of the story.
Geo-Political:
China’s economy has been under pressure for several years, driven by over-development in the real estate sector. The government is stepping in to try and stabilize it.
“BEIJING/HONG KONG, May 17 (Reuters) – China announced “historic” steps on Friday to stabilise its crisis-hit property sector, with the central bank facilitating 1 trillion yuan ($138 billion) in extra funding and easing mortgage rules, and local governments set to buy “some” apartments.
Investors hoped the measures marked the beginning of more decisive government intervention to compensate for waning demand for new and old apartments, to slow down falling prices and to reduce a growing stock of unsold homes.
Analysts have long called for the government to step in with its own purchases to prop up a sector which at its peak accounted for a fifth of GDP and remains a major drag on the world’s second-biggest economy.
Since the property market began its steep downturn in 2021, a string of developers have defaulted, leaving scores of idle construction sites behind, and sapping confidence in what had for decades been the preferred savings instrument for the Chinese population.
China Real Estate Newspaper, a publication managed by the housing ministry, said the “heavyweight policies” marked “a significant historic moment” for the sector.
China’s CSI 300 Real Estate index of shares jumped 9.1% on the announcements.
“It’s a bold step,” said Raymond Yeung, chief Greater China economist at ANZ of the measures.
“The biggest problem is whether the government purchase programme will induce private sector demand. Clearing inventory will increase cashflow to developers and help their financial stability, but it does not address private sector confidence.”
Whether government programs work depends on how big the problem is, how big the action is, and how directly the program addresses the problem.
Technical Analysis:
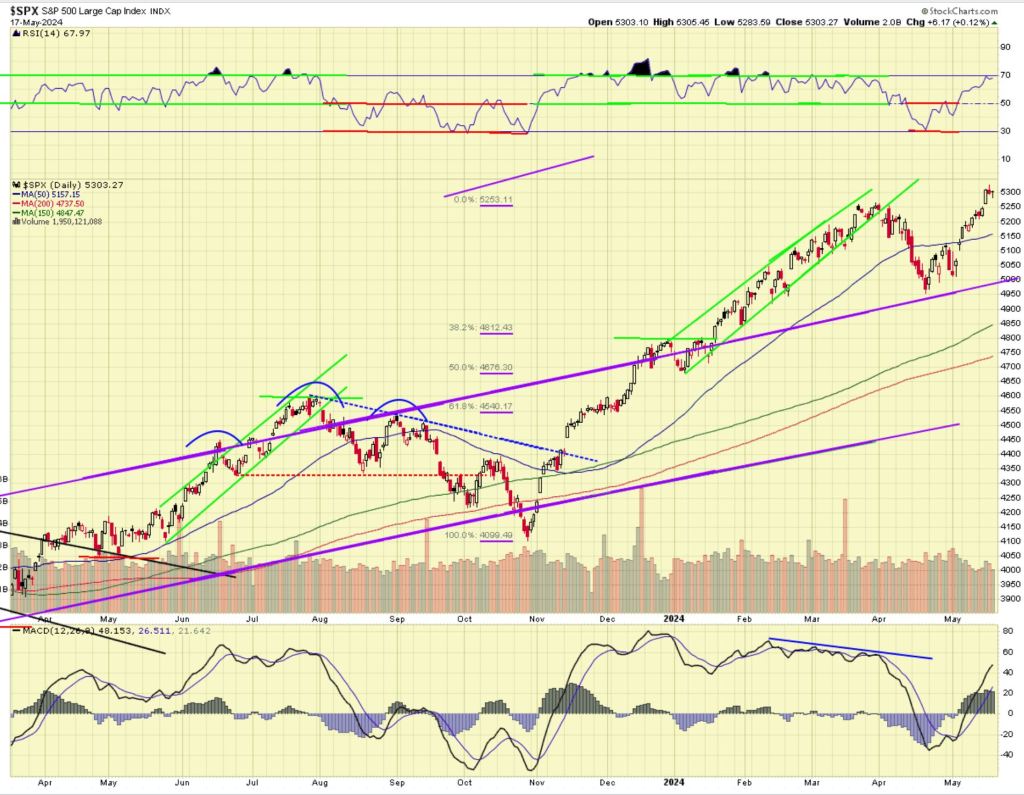
For the week ending 5/17/2024, the S&P 500 was up about 1.5%.
Technically (see chart below) the market looks positive. RSI at the top of the chart is overbought at 70, but in a bull market things can stay overbought for a while. Momentum shown by MACD at the bottom of the chart is positive and rising. The price action is positive, setting a new record high during the week and closing the week just over 5300.
The resistance at 5250 has been cleared so the path higher is cleared. The CPI retreated a meager .1%, but that does not indicate a resurgence of inflation. Earning continue to come in good, except I don’t like retailers. The general tone of the market seems positive. It seems like the market wants to rise, but it is moving slowly.
NVDA reports on 5/22 and that may set the tone for the next week or so. If they beat earnings and offer good guidance like they have been doing, that should keep the market going.
With the market overbought and so many stocks overbought, I don’t want to add individual stocks here. It is a lot of detail to manage. I have been adding to SPY, basically “buying the market”, in small increments, and I increase the number of shares in the trailing stop loss order on SPY. I can go up, but not drop to far.
What am I doing? I snugged up some trailing stop loss orders, in particular under SPY. I sold a few stocks setting record highs, with hope to buy them back lower. I had 17 option positions expire on5/17 and I kept 16 premiums. I had PANW called away at a nice profit, and I will try to buy it back lower in the future.
———————–
If you enjoy these updates, please tell your friends and family who are interested in the stock market about this blog.
I would like to call your attention to a page of my blog called “CLASSICS”. It is located at the top of the blog, on the banner just under the title. The banner has links to “Home”, “About”, and now “Classics”. These are articles that I wrote one time for the blog, but they are valuable insights at all times for investors. I will announce in the weekly blog when I add a new classic.
There are currently 3 Classic topics posted:
Is it a bull market or a bear market?
Why does healthcare cost so much?
Implications of a large national debt. (posted August 2022)
Your comments and questions are always appreciated, so feel free to comment using the “Leave a Comment” feature just under the title of the post.
You can use the hyperlink below the chart of the S&P that will open a larger picture of the chart in a separate window. The reader who suggested this wants to look at the chart side-by-side with the blog text. If you bookmark the link to the chart you can look at it each day of the week to see how the market is progressing to certain milestones. The picture in this post is a static .jpg so it does not update.
I am a retired person and preserving capital and seeking income are important objectives for me. I also want a growth component to my portfolio, while minimizing major risk. My style of investing will not suit everyone. I like to sleep well at night. Investing involves risk, including the risk of loss.
I update each Saturday with my view of the stock market for the next few weeks (if occupied with family or travel, rarely I am a day or two late, just check back). The monthly “Long Term” update will be on the first Wednesday of each month, and this supports investors who want to buy and hold, but want to sell to avoid the bulk of a primary bear market, and buy back in for most of the next bull market.
If you lose your bookmark to the blog, google “Rich Investing Blog” and it should show up on the first page or so.
Economy:
It was a quiet week for economic statistics. Initial jobless claims for the prior week were 231K, which is higher than the recent trend closer to 210K. Anything under 250K is normal, but lets keep an eye on this and see it it continues elevated. Interest rates backed down from their recent peak in hopes that a weaker job market would motivate the Fed to ease rates sooner, but one data point does not make a rate cut.
Geo-Political:
The Middle East was quiet but I suspect it will heat up again.
Mildly good news from England:
“May 9, 2024 – The economy grew by 0.6% between January and March, the fastest rate for two years, official figures showed.
The UK fell into recession at the end of last year after shrinking for two three-month periods in a row.
Prime Minister Rishi Sunak said the economy had “turned a corner”, but Labour said this was no time for a “victory lap”.
On Thursday, the governor of the Bank of England, Andrew Bailey, told the BBC that the UK was seeing a recovery, although it was not a strong one.
Interest rates are currently at their highest for 16 years, meaning people are paying more to borrow money for things such as mortgages and loans, but savers have also received better returns.
Mortgage rates have been creeping up in recent weeks, after forecasts for when the Bank of England would cut borrowing costs were pushed back.
On Thursday, the Bank said that inflation, which measures the rate prices rise at, would fall close to its target level in the next couple of months. That had boosted expectations of a rate cut in June. However, the stronger than expected growth figures have dampened those expectations.
Ruth Gregory, deputy chief UK economist at Capital Economics, said it showed “the Bank of England doesn’t need to rush to cut interest rates”.
She said the first rate cut would ultimately be determined by upcoming employment and inflation figures.”
When the economy of our trading partners do well, it helps the US economy because they will buy more from the US.
China’s President Xi Jinping was in Europe last week. European leaders are concerned about China dumping subsidized EV’s on their market, and they are opposed to China selling dual use goods to Russia that can be used in the war on Ukraine. Both concerns appeared to fall on deaf ears.
“May 10, 2024 – Xi’s main aim with the visit, analysts say, was pushing for a world where the United States is less dominant, and controlling damage to China’s ties with the European Union as trade tensions grow amid a threat of European tariffs and a probe into Chinese subsidies for electric vehicles that officials say are hurting local industries.
Throughout Xi’s two-day trip to France, Macron pressed the Chinese leader to address Beijing’s trade imbalances with the EU – with the bloc running a goods trade deficit of 292 billion euros ($314.72bn) last year – and to use his influence on Russian President Vladimir Putin to end the war in Ukraine.
Macron invited European Commission President Ursula von der Leyen to join his talks with Xi, to underline European unity on calls for greater access to the Chinese market and to address the bloc’s complaints regarding its excess capacity in electric vehicles and green technology. The pair also pushed Xi to control the sales of products and technologies to Russia that can be used for both civilian and military purposes.
But the Chinese leader appeared to have offered few concessions.
Xi denied there was a Chinese “overcapacity problem” and only reiterated his calls for negotiations to end the war between Russia and Ukraine. Xi, who is expected to host Putin in China later this month, said he called on all parties to restart contact and dialogue.
“Both trade and Russia are non-negotiable for China. Macron could not achieve anything [on those fronts],” said Shirley Yu, political economist and senior fellow at the London School of Economics in the United Kingdom.
But she suggested the visit furthered Macron’s personal relationship with Xi, one that is part of the French leader’s strategy to make France a crucial partner to all emerging world powers.
“Macron shares one vision in common with Xi, which is that the US hegemony – including the quest for Europe’s allegiance to the US’s foreign policy – must yield to a multipolar global order by accommodating the rising powers’ interests and concerns,” Yu told Al Jazeera. Macron’s recent visits to India and Brazil also “prove that France wants to stay at the forefront of that global shift,” she added.
I continue to be unimpressed with the Chinese president. Time after time when people engage with him, he wants to get something from them, but he declines to engage on their issues. This seems to lead to nothing getting done.
The article above suggests that Europe is tiring of simply following the US lead on foreign policy issues. Right, wrong or indifferent, things are changing. It is better to be aware of what is going on.
You may wonder why I used Al Jazeera as a source, but after reading articles from Europe and the US, I thought they had the best coverage.
Technical Analysis:
For the week ending 5/10/2024, the S&P 500 was up abouts 2%.
Technically (see chart below) the market looks positive. RSI at the top of the chart is neutral at 62 and rising. Momentum shown by MACD at the bottom of the chart is positive and rising. The price action is positive.
So, everything is OK, right? Not so fast my friend! The all-time high on the S&P was just back in March at 5250 and that is now resistance. We may bust through it and go on to new highs, or we could fail at the resistance and resume the correction downward. Earnings reports for Q1 have been good, but in a few important cases, guidance for Q2 has been light. Some retailers report that consumers are rejecting high prices. Starbucks reports some weakness, and McDonalds as well. McDonalds is bringing back a value meal. The market is still richly valued on a PE basis, and after the strong rise off the October low, it seems that just a 5% correction might not be enough. I’m cautious, unless we definitively break above the old record high.
It’s funny, but the higher initial jobless claims and reports of consumers balking at higher prices increase the odds that the Fed may cut rates so the economy does not slow too much. They don’t want to provoke a recession. So, “bad news is good news”, because it increases the likelihood of a Fed rate cut, and the stock market wants a easing Fed. So right now, the stock market is going up on news of economic weakness.
What am I doing? I took a few profits on stocks I bought near the April lows. I bought them for trades thinking we would rally, then possibly correct some more. The stocks I sold might go higher, but there’s an old saying, “I never knew a man that went broke taking a profit”.
———————–
If you enjoy these updates, please tell your friends and family who are interested in the stock market about this blog.
I would like to call your attention to a page of my blog called “CLASSICS”. It is located at the top of the blog, on the banner just under the title. The banner has links to “Home”, “About”, and now “Classics”. These are articles that I wrote one time for the blog, but they are valuable insights at all times for investors. I will announce in the weekly blog when I add a new classic.
There are currently 3 Classic topics posted:
Is it a bull market or a bear market?
Why does healthcare cost so much?
Implications of a large national debt. (posted August 2022)
Your comments and questions are always appreciated, so feel free to comment using the “Leave a Comment” feature just under the title of the post.
You can use the hyperlink below the chart of the S&P that will open a larger picture of the chart in a separate window. The reader who suggested this wants to look at the chart side-by-side with the blog text. If you bookmark the link to the chart you can look at it each day of the week to see how the market is progressing to certain milestones. The picture in this post is a static .jpg so it does not update.
I am a retired person and preserving capital and seeking income are important objectives for me. I also want a growth component to my portfolio, while minimizing major risk. My style of investing will not suit everyone. I like to sleep well at night. Investing involves risk, including the risk of loss.
I update each Saturday with my view of the stock market for the next few weeks (if occupied with family or travel, rarely I am a day or two late, just check back). The monthly “Long Term” update will be on the first Wednesday of each month, and this supports investors who want to buy and hold, but want to sell to avoid the bulk of a primary bear market, and buy back in for most of the next bull market.
Notice I am changing the Long Term report from the last Thursday to the first Wednesday. I have not liked writing on Wed. night and again Friday night, so this will put another day without writing after Tuesday night.
If you lose your bookmark to the blog, google “Rich Investing Blog” and it should show up on the first page or so.
Economy:
The Case Schiller home price index of 20 cities for Feb. is still running hot at +7.3% over Feb. 2023. That will make it hard for inflation to fall to 2%. The ISM manufacturing index for April fell slightly to 49.3. The ISM services index for April fell to 49.4, the first time is has been below 50 in a while. Factory orders for March rose 1.6%, that’s good. The US created 175K non-farm jobs in April, below the recent trend around 200K, while the unemployment rate ticked up to 3.9%.
The picture I see looks like a “soft landing”, which is what the Fed said they need to see in order to get inflation down to 2%. Powell has talked about a period of “below trend growth”, and that is what I see. GDP at +1.6% in Q1, ISM manufacturing and services marginally below 50, job creation slowing, unemployment ticking up just slightly, and inflation down from 9% to 3%. The trick is to slow the economy enough to bring inflation down, without inducing a serious recession. So far, it looks like the Fed is succeeding. The Fed was wrong to believe inflation was transitory, but after that their actions look good.
Geo-Political:
On Wed. 5/1 Fed Chair Powell said the Fed was leaving the Fed Funds rate unchanged. He said the committee was not confident that inflation was on track to 2%. He said a rate hike in the future was not impossible, but that is not under consideration now. I don’t think we will see inflation at 2% this year, but I think 2025 is possible.
The stock market liked the message and rallied strongly.
The Middle East has calmed a bit as Iran and Israel did not attack each other directly last week, so that was positive. Hamas still holds out in southern Gaza and Israel wants to take them out. The US does not want to see them destroy Rafah in order to achieve their goal. We’ll see.
Technical Analysis:
For the week ending 5/3/2024, the S&P 500 was up about .5%.
Technically (see chart below) the market looks neutral near term. RSI at the top of the chart is neutral at 52 and rising. Momentum shown by MACD at the bottom of the chart is neutral. The price action is neutral, moving sideways.
The national news is generally good, and the technicals are indeterminant.
The S&P rallied off the 5% correction low but it has stopped at the 50-day moving average last week. Now it is back hitting resistance at the 50-day moving average again. Will it break through to the upside, or fail and correct some more? I don’t know. The Fab Five stocks are growing earnings, and their size is so large they can carry the other 495 stocks. Most of the earnings reporting is done and that is what the market will have to deal with, the remaining earnings reports. I have my eye on the long term growth channel (the two purple lines rising to the right) to see if the market goes back to that growth rate. There is strong support at the 200-day moving average at 4700.
I added the Fibonacci sequence to the chart, which goes from the Oct. low to the March high. These are the five small horizontal purple lines in Oct. Fibonacci was a mathematician who observed that this sequence occurs in nature often. Stock market observers seem to accept it on faith and believe that they represent possible correction retracement levels. I don’t agree, but let’s all watch for a few months. It is possible that if the computer programs target the Fibonacci levels, they may work these days just because everyone has programmed them in and given them significance.
What am I doing? I didn’t do much with the market bouncing around in a small range. I’m selling covered calls when stocks bounce high enough, and selling Put options when stocks drop a lot. It was a lot of small stuff.
———————–
If you enjoy these updates, please tell your friends and family who are interested in the stock market about this blog.
I would like to call your attention to a page of my blog called “CLASSICS”. It is located at the top of the blog, on the banner just under the title. The banner has links to “Home”, “About”, and now “Classics”. These are articles that I wrote one time for the blog, but they are valuable insights at all times for investors. I will announce in the weekly blog when I add a new classic.
There are currently 3 Classic topics posted:
Is it a bull market or a bear market?
Why does healthcare cost so much?
Implications of a large national debt. (posted August 2022)
Your comments and questions are always appreciated, so feel free to comment using the “Leave a Comment” feature just under the title of the post.
You can use the hyperlink below the chart of the S&P that will open a larger picture of the chart in a separate window. The reader who suggested this wants to look at the chart side-by-side with the blog text. If you bookmark the link to the chart you can look at it each day of the week to see how the market is progressing to certain milestones. The picture in this post is a static .jpg so it does not update.
I am a retired person and preserving capital and seeking income are important objectives for me. I also want a growth component to my portfolio, while minimizing major risk. My style of investing will not suit everyone. I like to sleep well at night. Investing involves risk, including the risk of loss.